15 Ecommerce KPIs Any Online Business Should Track
Ecommerce KPIs track how well your online store is performing. These metrics provide insights into different areas of your business, like marketing, sales, and customer service. By monitoring these KPIs, you can identify strengths and weaknesses and improve your e-commerce strategy.
Running a successful online business requires constantly tracking your performance and making adjustments. But with so much data available, it can be overwhelming to know what metrics truly matter.
This article dives deep into 15 essential ecommerce KPIs you should be tracking. We’ll explain what each metric means, why it’s important, and how to interpret the data to make informed decisions for your business growth.
Change the way you work with agentic AI
One-click dashboards,KPI tracking, and AI-powered insights—for work that actually gets done.

What are e-commerce KPIs?
Ecommerce KPIs, or key performance indicators, are metrics that track how well your online store is performing. They provide insights into various aspects of your business, from sales and marketing to customer behavior, as well as the effectiveness of your e-commerce development services.
To enhance the responsiveness and efficiency of analyzing these metrics, implementing a fast-track data analysis tool can provide real-time insights, allowing you to make quick adjustments and improve your operational strategies effectively.
Businesses looking to act on these insights efficiently rely on fast data-analysis tools that deliver real-time metrics. Elogic Commerce brings together data from multiple sources and streamlines KPI tracking, providing a clearer view of performance and supporting informed decision-making.
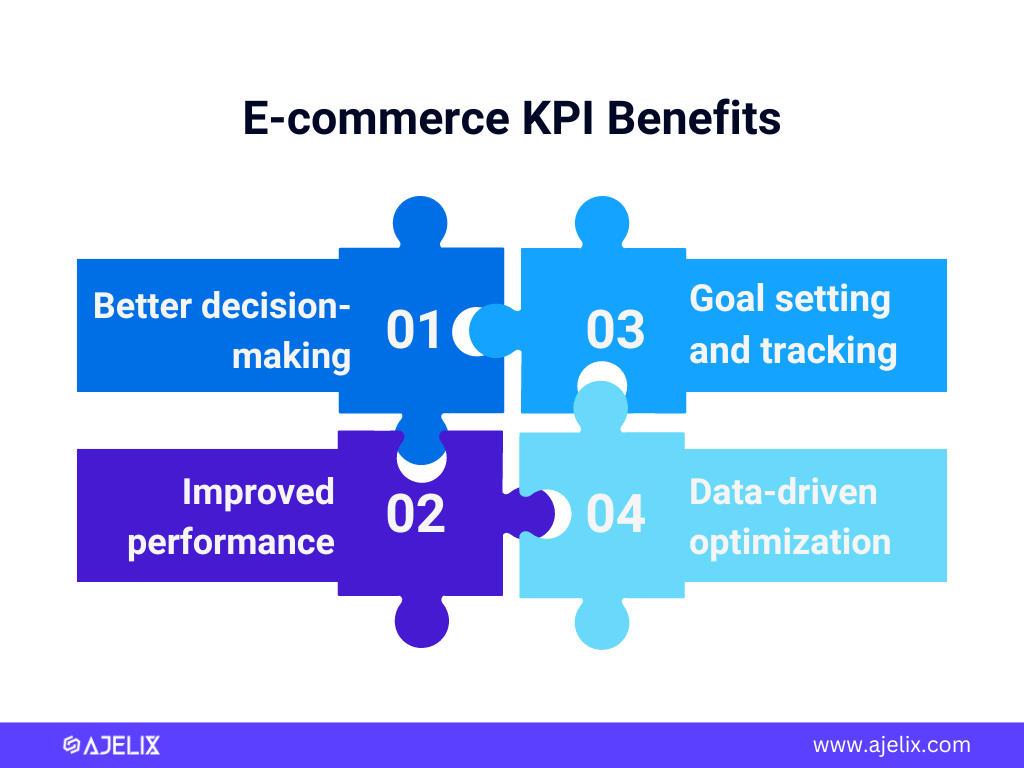
By monitoring these KPIs, you can identify areas for improvement and make data-driven decisions to grow your online store.
- Better decision-making: KPIs provide data to support your choices, not just hunches.
- Goal setting and tracking: metrics help define goals and measure progress towards them.
- Improved performance: identify strengths and weaknesses to optimize your ecommerce strategy.
- Data-driven optimization: KPIs guide efforts to improve sales, marketing, and customer experience.
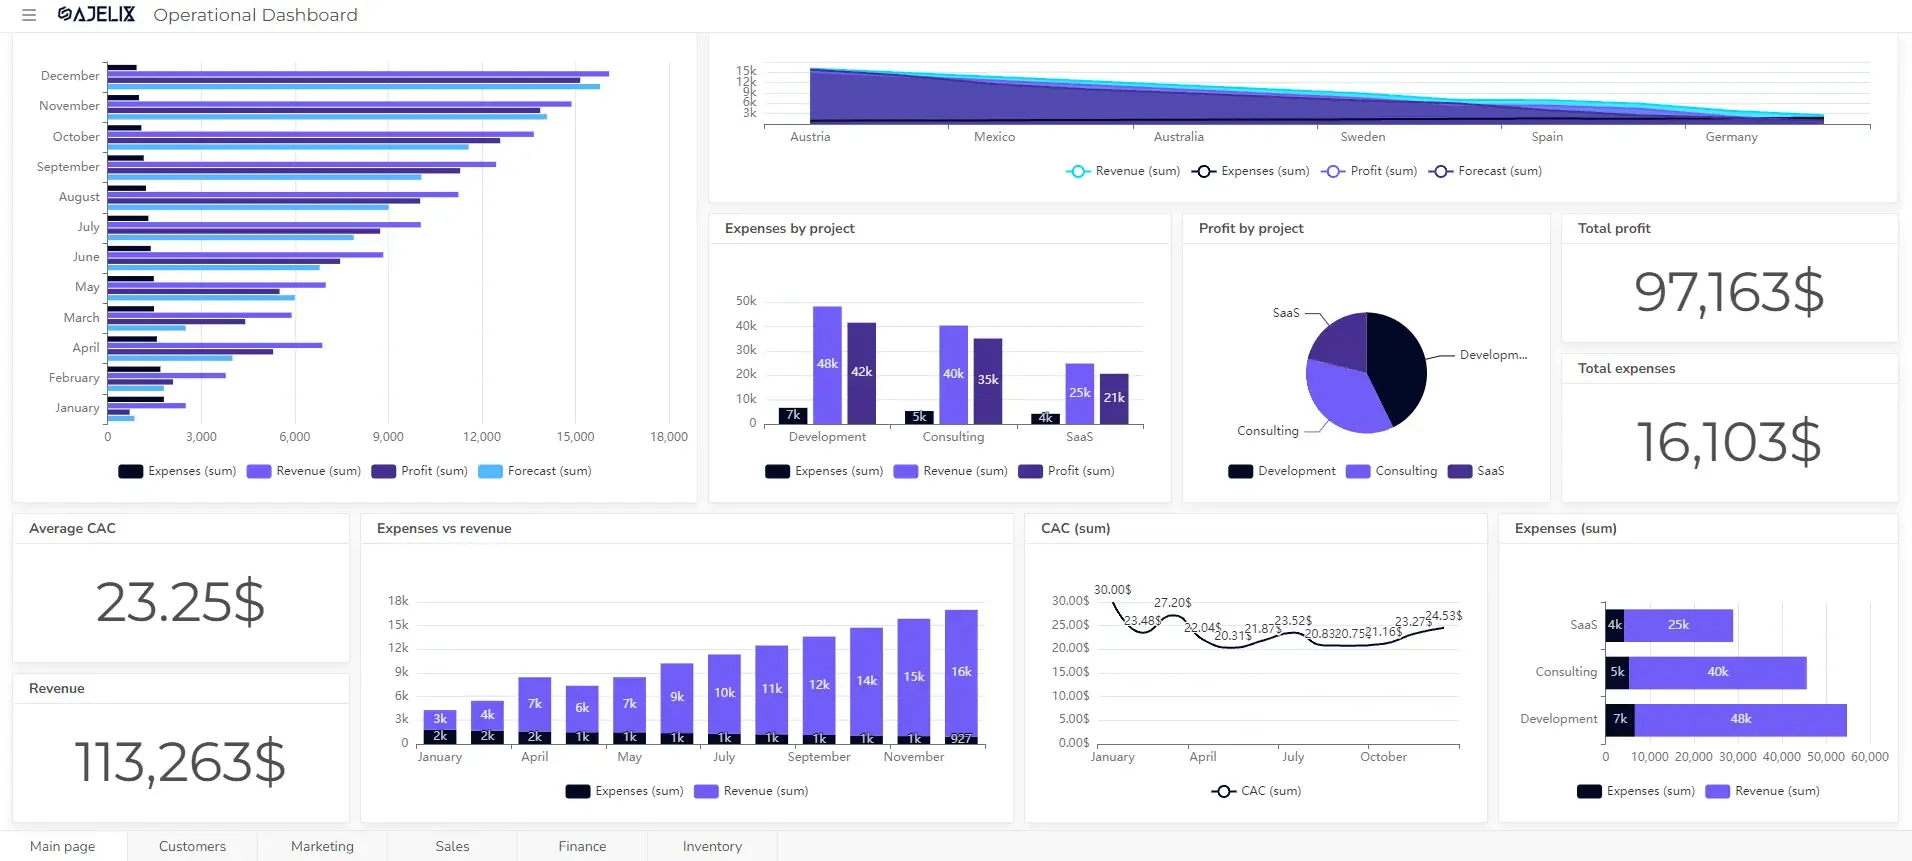
Did you know you can automate the KPI calculation process and get live updates for your data? Set up your accounting KPI dashboard on Ajelix BI.
15 Most Important Ecommerce KPIs List
Here are the 15 most popular ecommerce KPIs for business owners:
- Overall Sales
- Net Profit
- Average Order Value (AOV)
- Number of Orders
- Customer Lifetime Value (CLTV)
- Customer Acquisition Cost (CAC)
- Return on Ad Spend (ROAS)
- Website Metrics
- Bounce Rate
- Conversion Rate
- Customer Satisfaction Score (CSAT)
- Net Promoter Score (NPS)
- Customer Retention Rate
- Cart Abandonment Rate
- Hit Rate
Struggling with manual calculations & tiring setups?
Let agentic AI do the heavy lifting.
Start free
Fast sign up & easy setup
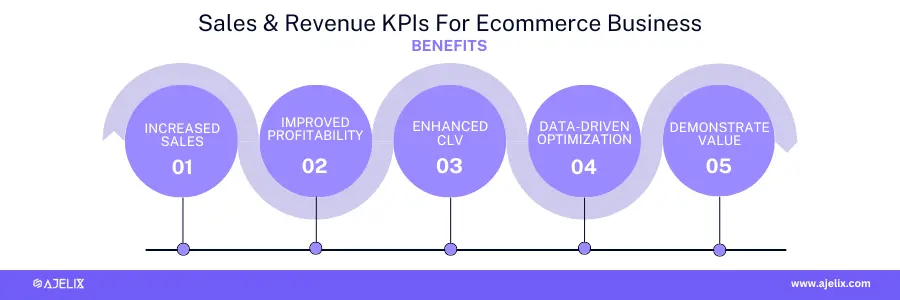
1. Sales & Revenue KPIs For Ecommerce
The main goal of tracking sales and revenue ecommerce KPIs is to achieve sustainable growth for your online store.
- Increased Sales: Ultimately, you want your e-commerce business to generate more revenue.
- Improved Profitability: Sales are only part of the equation, ensure your business operates efficiently and generates healthy profits. For your food eCommerce brand, this means optimizing inventory management and leveraging data-driven insights to reduce costs and improve customer satisfaction.
- Enhanced Customer Lifetime Value: focus on strategies that not only acquire new customers but also retain existing ones.
- Data-Driven Optimization: optimize your e-commerce operations.
1.1. Overall Sales
This tracks your total revenue generated over a specific period. It’s a foundational metric to understand your business’s health and growth.
Formula: (Current Period Sales – Prior Period Sales) / Prior Period Sales * 100
- Current Period Sales: Total revenue generated in the current period (e.g., month, quarter, year).
- Prior Period Sales: Total revenue generated in the previous period you’re comparing to (e.g., previous month, quarter, year).
Example:
If your sales were €10,000 last month and €12,000 this month, your sales growth rate would be:
((€12,000 – €10,000) / €10,000) * 100 = 20%
A positive sales growth rate is generally desired, indicating your business is growing. The “good” score depends on your industry, maturity, and goals. For instance, a new startup might aim for a higher growth rate (e.g., 50%) than a well-established company (e.g., 10%).
1.2. Net Profit
Net profit shows your earnings after accounting for all expenses. Monitoring this KPI helps ensure you’re running a profitable business.
Formula: Net Profit Margin = (Net Profit / Total Revenue) x 100
- Net Profit: your business’s earnings after subtracting all expenses from total revenue. It represents your actual profit.
- Total Revenue: the total income generated from sales before any deductions.
Calculate your KPI using our net profit margin calculator.
Example:
Let’s say your e-commerce store had €10,000 in total monthly revenue and €2,000 in expenses (cost of goods sold, operating expenses, etc.).
- Net Profit = €10,000 (Revenue) – €2,000 (Expenses) = €8,000
- Net Profit Margin = (€8,000 / €10,000) x 100 = 80%
What’s a good score?
A “good” net profit margin can vary depending on the industry. Generally, a higher net profit margin is desirable as it indicates a more efficient business model that generates a larger profit from its revenue. Here’s a rough guideline:
| Score | Interpretation |
|---|---|
| Above 10% | considered good for many industries |
| Above 20% | excellent for some industries like software or luxury goods |
| Below 5% | might be cause for concern, especially if your industry average is higher |
1.3. Average Order Value (AOV)
The Average Order Value (AOV) is a crucial KPI in e-commerce, indicating the average amount a customer spends per order. Here’s the formula:
AOV = Total Revenue / Number of Orders
- Total Revenue: This is the total amount of income your e-commerce store generated from sales in a specific period (e.g., month, quarter).
- Number of Orders: This is the total number of orders placed by customers during the same period.
Example:
Imagine your e-commerce store had a total revenue of €10,000 in a month and received 50 orders.
- AOV = €10,000 (Total Revenue) / 50 (Number of Orders) = €200
Good AOV Score:
There’s no universal “good” AOV score as it depends on your industry, product type, and target audience. A higher score is generally better as it indicates customers are purchasing more per visit. Analyze your industry benchmarks to understand a good AOV range for your niche. Track your historical AOV to see if it’s increasing or decreasing over time.
1.4. Number of Orders
The total number of orders placed in a given period. Analyze this alongside AOV to understand sales trends. There isn’t a standard formula for a “Number of Orders rate” in e-commerce. It’s more common to track the raw number of orders or the growth rate of orders over time.
Order Growth Rate = ((Current Period Orders – Prior Period Orders) / Prior Period Orders) x 100
Example:
- If your store received 100 orders in May and 120 orders in June:
- Order Growth Rate = ((120 – 100) / 100) x 100 = 20%
Good Scores:
There’s no single “good” number of orders or growth rate. It depends on your industry, business maturity, and goals.
1.5. Customer Lifetime Value (CLTV)
This metric predicts the total revenue a customer brings to your business throughout their relationship. It’s crucial to focus on strategies that increase CLTV. Here’s a formula:
CLTV = Average Purchase Value x Average Customer Lifespan
You can easily calculate this metric using our online CLV calculator here.
Explanation of Variables:
- Average Purchase Value (APV): the average amount a customer spends per order. You can calculate it using the formula: *Total Revenue / Number of Orders = APV
- Average Customer Lifespan (ACLS): the average period a customer continues to make purchases from your store. It’s estimated based on historical data or industry benchmarks.
Example:
Let’s say your e-commerce store has an APV of €50 and estimates an ACLS of 2 years (24 months).
- CLTV = €50 (APV) x 24 (ACLS) = €1,200
Important Note:
This is a simplified formula. More sophisticated CLTV calculations might consider factors like customer segmentation, discount rates, and churn rates.
Good CLTV Score:
A “good” CLTV score depends on your industry, customer acquisition cost (CAC), and profit margins. A CLTV exceeding your CAC indicates a profitable customer relationship over their lifetime. The higher the CLTV relative to CAC, the better. This signifies a strong customer base generating value for your business.
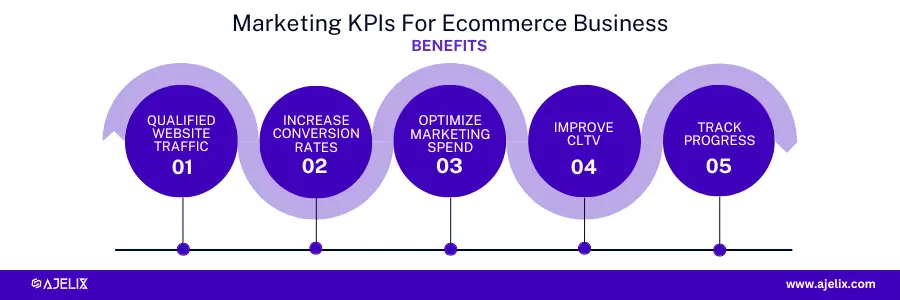
2. E-commerce Marketing KPIs
The main goal of tracking e-commerce marketing KPIs is to maximize the efficiency and effectiveness of your marketing efforts in driving sales and revenue growth. By analyzing these metrics, you can:
- Attract more qualified website traffic: Improve your targeting and content to attract visitors who are more likely to convert into paying customers.
- Increase conversion rates: Optimize your website and user experience to encourage visitors to take the desired actions (e.g., add items to cart, complete purchases).
- Optimize marketing spend: Allocate resources towards campaigns and channels with the highest return on investment (ROI).
- Improve customer lifetime value (CLTV): Track metrics that reflect customer loyalty and repeat purchases to build stronger customer relationships.
- Track Progress and Set Goals: track the progress of your marketing initiatives and measure their impact on sales and website traffic.
2.1. Customer Acquisition Cost (CAC)
This tracks how much you spend to acquire a new customer. Keeping your CAC low is essential for maintaining profitability.
CAC = Total Customer Acquisition Costs / Number of New Customers Acquired
Calculate this metric using our online customer acquisition cost calculator.
- Total Customer Acquisition Costs: includes all expenses associated with acquiring new customers. It can involve marketing costs (advertising, social media), sales commissions, content creation, website development efforts directed at acquiring new customers, and similar expenses.
- Number of New Customers Acquired: the total number of new customers you brought in during a specific period (e.g., month, quarter).
Example:
Imagine your e-commerce store spent €5,000 on marketing and sales efforts in a month and acquired 25 new customers.
- CAC = €5,000 (Total Costs) / 25 (New Customers) = €200 per customer
Good CAC Score:
A “good” CAC depends on your industry, average order value (AOV), and customer lifetime value (CLTV). Your CAC should ideally be lower than your AOV. This ensures you make a profit on each customer acquisition. A lower CAC relative to CLTV is preferable. This indicates you’re acquiring customers who generate value for your business over their lifetime.
2.2. Return on Ad Spend (ROAS)
This metric measures the advertising revenue generated for every euro spent on ads. It helps you assess the effectiveness of your marketing campaigns.
ROAS = Revenue Attributed to Ads / Cost of Ads
- Revenue Attributed to Ads: represents the total sales generated from customers who were specifically influenced by your advertising efforts. Accurately attributing revenue can be complex, and some ecommerce platforms offer tools to help with this.
- Cost of Ads: the total amount you spent on your advertising campaigns
during the same period you’re measuring revenue for (e.g., Facebook Ads, Google
Ads SaaS).
Example:
Let’s say your e-commerce store generated €3,000 in sales from customers who clicked on your ads in a month, and you spent €500 on those specific ad campaigns.
- ROAS = €3,000 (Revenue from Ads) / €500 (Ad Costs) = 6
Good ROAS Score:
A “good” ROAS depends on your industry, advertising platform, and profit margins. Here’s a general guideline:
- A ROAS greater than 1 indicates you’re generating more revenue than you’re spending on ads.
- The higher the ROAS, the better. It signifies a more efficient advertising campaign that delivers a good return on your investment.
2.3. Website Metrics
The total number of visitors to your online store. Monitor traffic sources to understand where your audience comes from. It’s more common to track the following website traffic metrics:
- Total Website Sessions: the total number of times users visit your website within a specific period (e.g., day, week, month). It’s a basic measure of website activity.
- Unique Visitors: counts the number of individual users who visit your website during a specific period. It avoids double-counting users who visit multiple times.
- Traffic Sources: shows where your website traffic originates from (e.g., organic search, social media referrals, paid advertising). It helps you understand which channels are driving visitors to your store.
Example:
- Your website might have had 10,000 sessions and 5,000 unique visitors in a month.
- Traffic source analysis might reveal 60% of traffic came from organic search, 20% from social media, and 20% from paid ads.
2.4. Bounce Rate
The percentage of visitors who leave your website after viewing only one page. A high bounce rate indicates a need to improve website engagement.
Bounce Rate = Single-Page Sessions / Total Sessions * 100
- Single-Page Sessions: sessions where a user only views one page on your website and triggers no further actions before leaving. This might indicate a lack of engagement with your content or difficulty navigating your website.
- Total Sessions: refers to the total number of times users visit your website within a specific period (e.g., day, week, month).
Example:
Imagine your e-commerce website had 1,000 total sessions in a month, and 600 of those sessions only viewed one page before leaving.
- Bounce Rate = (600 Single-Page Sessions) / (1,000 Total Sessions) * 100 = 60%
Bounce Rate Interpretation
| Category | Bounce Rate Range | Possible Reasons | Actionable Insights |
|---|---|---|---|
| Excellent | Below 20% | Highly engaged visitors find the information they need quickly. | Maintain current website experience and content strategy. |
| Good | 20% – 40% | Visitors are somewhat engaged, but there might be room for improvement. | Analyze bounce rate by traffic source and landing page. Consider A/B testing CTAs, content, or website navigation. |
| Acceptable | 40% – 55% | Somewhat high bounce rate, especially for product pages. | A very high bounce rate suggests major problems with website usability or content relevance. |
| Needs Improvement | 55% – 70% | High bounce rate indicates significant user frustration or lack of engagement. | Conduct user experience testing to identify pain points. Address website navigation issues, loading speed problems, or unclear product information. |
| Poor | Above 70% | A high bounce rate indicates significant user frustration or lack of engagement. | Consider a website overhaul to improve user experience, information architecture, and content strategy. |
2.5. Conversion Rate
This metric measures the percentage of visitors who make a purchase. Optimizing your website and checkout process can significantly improve conversion rates. You can work with professionals to help improve the user experience on your website or partner with an open banking provider to ensure a smooth checkout process.
Conversion Rate = Conversions / Total Visitors * 100
- Conversions: the total number of desired actions visitors take on your website within a specific period (e.g., day, week, month). In e-commerce, a conversion typically refers to a completed purchase, but it could also include actions like adding items to a cart, signing up for an email list, or initiating a live chat.
- Total Visitors: the total number of users who visit your website during the same period you’re measuring conversions.
Example:
Let’s say your e-commerce website had 1,000 visitors in a month, and 50 of those visitors completed a purchase.
- Conversion Rate = (50 Conversions) / (1,000 Total Visitors) * 100 = 5%
Good Conversion Rate Score:
A “good” conversion rate depends on your industry, niche, and the type of conversion you’re tracking (e.g., purchase vs. email sign-up). Conversion rates above 2% are considered good for many ecommerce businesses. Focus on improving your conversion rate consistently.
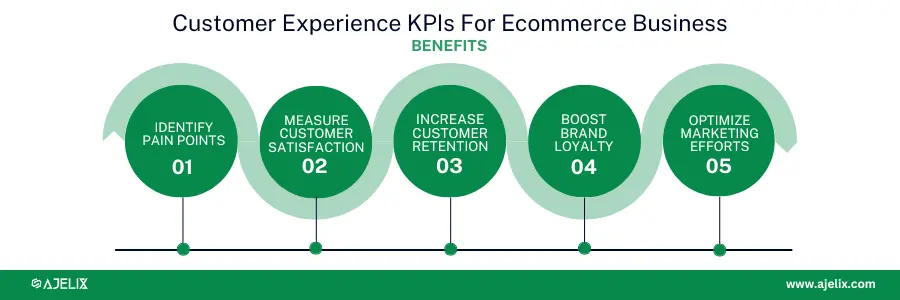
3. Customer Experience
The main goal of tracking E-commerce Customer Experience KPIs is to create a seamless, positive, and customer-centric online shopping experience. By analyzing these metrics, you can:
- Identify Pain Points: improve website navigation, product information clarity, or the checkout process to enhance user experience.
- Measure Customer Satisfaction: these scores can help you identify areas where customer service needs improvement or what aspects of your experience delight customers.
- Increase Customer Retention: identify at-risk customers and implement strategies (loyalty programs, personalized communication) to improve retention and build stronger customer relationships.
- Boost Brand Loyalty: understand what aspects of your experience create loyalty and identify areas for improvement to build a stronger brand reputation.
- Optimize Marketing Efforts: Understanding how customers interact with your website helps you tailor marketing messages and product recommendations to their needs and preferences. This can lead to more effective marketing campaigns with higher conversion rates.
3.1. Customer Satisfaction Score (CSAT)
Surveys that gauge customer satisfaction with a specific interaction (e.g., purchase, return). There isn’t a single, universally accepted formula for the Customer Satisfaction Score (CSAT) rate because it’s based on a survey asking customers about their experience. However, here’s a common approach to calculate it:
CSAT = (% of Satisfied Customers + % of Very Satisfied Customers) / 100
- Customer Satisfaction Survey: This survey asks customers to rate their satisfaction with a specific interaction (e.g., purchase, return, customer service experience). The scale can vary, but a common format uses options like “Very Satisfied,” “Satisfied,” “Neutral,” “Dissatisfied,” and “Very Dissatisfied.”
- Satisfied Customers + Very Satisfied Customers: This represents the percentage of customers who responded with a positive rating (typically the top two options in your scale).
Example:
Let’s say you send a CSAT survey after every purchase, and in a month you receive 100 responses. Out of those:
- 60 customers rated their experience as “Very Satisfied.”
- 30 customers rated it as “Satisfied.”
- The remaining 10 customers provided neutral or negative ratings.
- CSAT = ((60 Very Satisfied + 30 Satisfied) / 100) = 90%
Good CSAT Score:
A “good” CSAT score depends on your industry and the specific interaction you’re measuring satisfaction for. CSAT scores above 75% are generally considered good. Always strive to improve your CSAT score. A high CSAT indicates satisfied customers who are more likely to become repeat buyers and recommend your business to others.
3.2. Net Promoter Score (NPS)
Measures customer loyalty by asking how likely they are to recommend your business to others.
Net Promoter Score (NPS):
NPS measures customer loyalty and satisfaction by asking a single question:
- “How likely are you to recommend our business to a friend or colleague?”
Customers respond on a scale from 0 (not at all likely) to 10 (extremely likely).
NPS Categories:
Based on their responses, customers are categorized as:
- Promoters (9-10): Loyal enthusiasts who are likely to recommend your business and generate positive word-of-mouth.
- Passives (7-8): Neutral customers who might not be highly enthusiastic but aren’t unhappy either.
- Detractors (0-6): Unhappy customers who might spread negative word-of-mouth and discourage others from using your business.
Calculating NPS:
- NPS = % of Promoters – % of Detractors
Example:
Let’s say you send out an NPS survey and receive 100 responses:
- 60 customers rated your business as a 9 or 10 (Promoters).
- 20 customers rated it as a 7 or 8 (Passives).
- 20 customers rated it between 0 and 6 (Detractors).
- NPS = (60% Promoters) – (20% Detractors) = 40
NPS Score Interpretation
| NPS Score Range | Customer Sentiment | Likelihood to Recommend | Actionable Insights |
|---|---|---|---|
| 90 – 100 | Excellent | Promoters who are extremely likely to recommend your business | Maintain exceptional customer experience. Analyze what delights promoters to replicate it across all touchpoints. |
| 70 – 89 | Very Good | Promoters who are enthusiastic about recommending your business | Focus on retaining promoter loyalty. Implement referral programs or loyalty rewards to incentivize recommendations. |
| 50 – 69 | Good | Promoters outweigh detractors, but there’s room for improvement | Investigate what makes promoters happy and detractors unhappy. Address common detractor concerns to improve overall sentiment. |
| 30 – 49 | Below Average | More passives and detractors than promoters | Identify areas for improvement in customer experience. Conduct surveys or gather feedback to understand customer pain points. |
| 0 – 29 | Poor | Detractors significantly outnumber promoters | Take immediate action to address customer dissatisfaction. Implement changes based on customer feedback to improve loyalty. |
3.3. Customer Retention Rate
The percentage of returning customers over a specific period. Focus on strategies to retain existing customers, as they are more likely to repurchase.
Customer Retention Rate = ((Number of Customers at End of Period – Number of New Customers Acquired) / Number of Customers at Beginning of Period) x 100
Calculate this metric using our online customer retention rate calculator.
- Number of Customers at End of Period (E): This represents the total number of customers you have on your books at the end of the period you’re measuring (e.g., month, quarter, year).
- Number of New Customers Acquired (N): This is the total number of new customers you brought in during the same period.
- Number of Customers at Beginning of Period (S): This signifies the total number of customers you had at the start of the period you’re measuring.
Example:
Imagine your ecommerce store had the following numbers of customers:
- 100 customers at the beginning of the month (Number of Customers at Beginning of Period – S).
- 30 new customers acquired during the month (Number of New Customers Acquired – N).
- 110 customers at the end of the month (Number of Customers at End of Period – E).
Customer Retention Rate Calculation:
- CRR = ((110 Customers at End of Period – 30 New Customers Acquired) / 100 Customers at Beginning of Period) x 100
- CRR = (80 / 100) x 100
- CRR = 80%
Customer retention rate interpretation
| CRR Score | Interpretation | Actionable Insights |
|---|---|---|
| Above 80% | Excellent | You’re retaining a high percentage of your customer base. Focus on maintaining exceptional customer experience to continue fostering loyalty. |
| 70% – 80% | Good | You’re retaining a healthy portion of your customers, but there’s still room for improvement. Consider implementing strategies to further strengthen customer loyalty. Analyze churn reasons and implement targeted initiatives (loyalty programs, personalized marketing) to win back at-risk customers. |
| 50% – 69% | Below Average | You might be losing customers at a concerning rate. Take action to identify and address the reasons behind customer churn. Conduct surveys or gather feedback to understand customer pain points. |
| Below 50% | Poor | Urgent action is required to address significant customer churn. Analyze churn data thoroughly to pinpoint the root causes of customer dissatisfaction. Revamp your customer service approach, address product or service issues, and consider offering incentives to win back lost customers. |
3.4. Cart Abandonment Rate
The percentage of shoppers who add items to their cart but don’t complete the purchase. Analyze reasons for cart abandonment to streamline your checkout process.
CAR = (1 – Conversion Rate) x 100
- Conversion Rate: This represents the percentage of website visitors who complete a purchase (add items to cart and successfully checkout) during a specific period (e.g., day, week, month). You can calculate conversion rate using the formula:
- Conversion Rate = (Total Completed Purchases / Total Website Visitors) x 100
Example:
Imagine your ecommerce website had:
- 100 website visitors in a month.
- 10 completed purchases.
Conversion Rate Calculation:
- Conversion Rate = (10 Completed Purchases / 100 Website Visitors) x 100 = 10%
Cart Abandonment Rate Calculation (using the Conversion Rate):
- CAR = (1 – 10%) x 100 = 90%
Alternatively, you can calculate CAR directly if you have data on abandoned carts and total cart creations:
- CAR = (Number of Abandoned Carts / Number of Carts Created) x 100
Good Cart Abandonment Rate:
A “good” CAR depends on your industry, but here’s a general perspective:
- CAR below 70% is considered good. This indicates you’re converting a reasonable portion of website visitors into customers.
- The lower the CAR, the better. It signifies fewer abandoned carts and a more efficient checkout process.
3.5. Hit Rate
The number of customers contacting customer support about the same issue. A high hit rate indicates a recurring problem that needs to be addressed.
Hit Rate = (Number of Sales / Number of Website Visitors) x 100
- Number of Sales: This represents the total number of completed purchases on your website during a specific period (e.g., day, week, month).
- Number of Website Visitors: This signifies the total number of users who visit your website during the same period.
Example:
Imagine your e-commerce website had:
- 100 website visitors in a month.
- 10 completed purchases.
- Hit Rate = (10 Sales / 100 Website Visitors) x 100 = 10%
Good Hit Rate Score (Sales Conversion):
A “good” Hit Rate for sales conversion depends on your industry, but here’s a general perspective:
- Hit Rate above 2% is considered good for many e-commerce businesses.
- The higher the Hit Rate, the better. It signifies you’re converting a larger portion of your website traffic into sales.
How To Create A KPI Dashboard For E-commerce?
Time needed: 5 hours
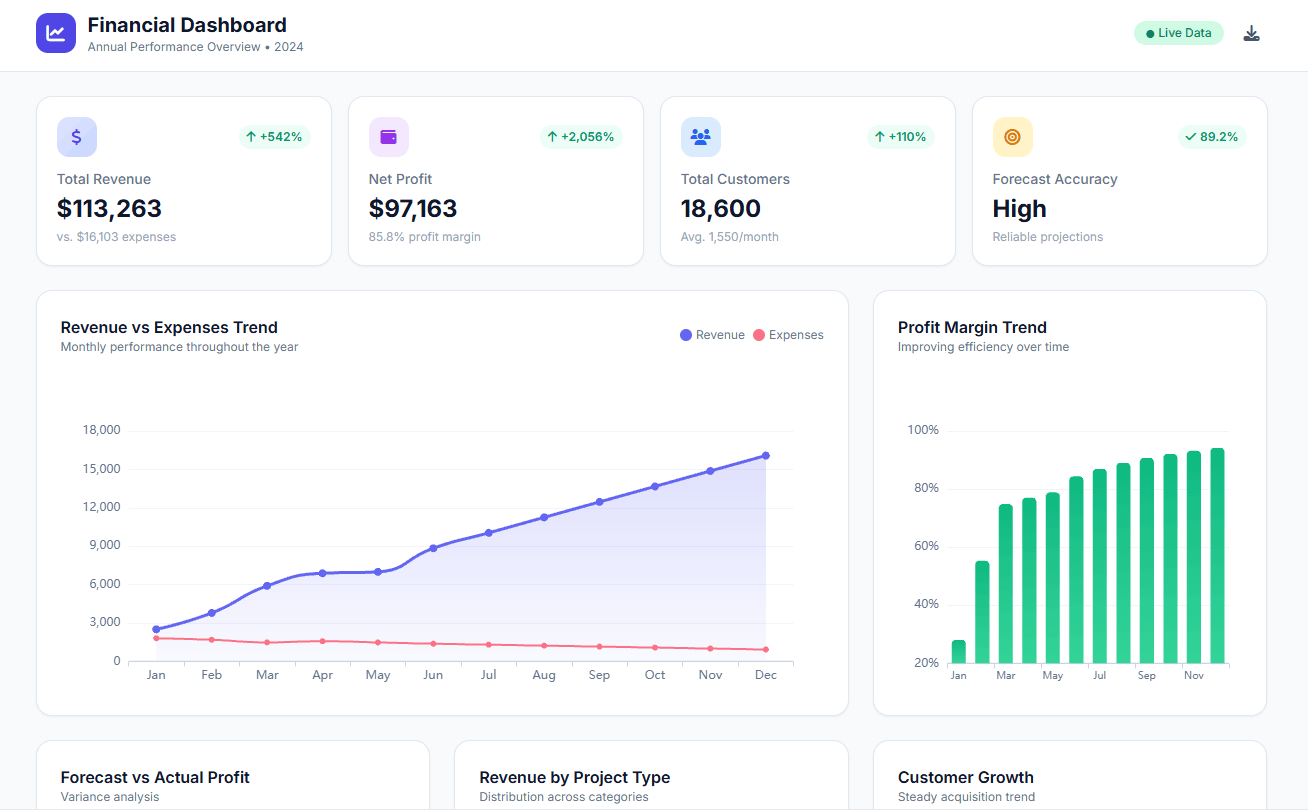
This guide will equip you with the knowledge to create an effective e-commerce KPI dashboard. We’ll explore how to design a dashboard that visually tracks your key performance indicators, helping you gain valuable insights into your online store’s performance. This guide will explain how to do this using Ajelix BI.
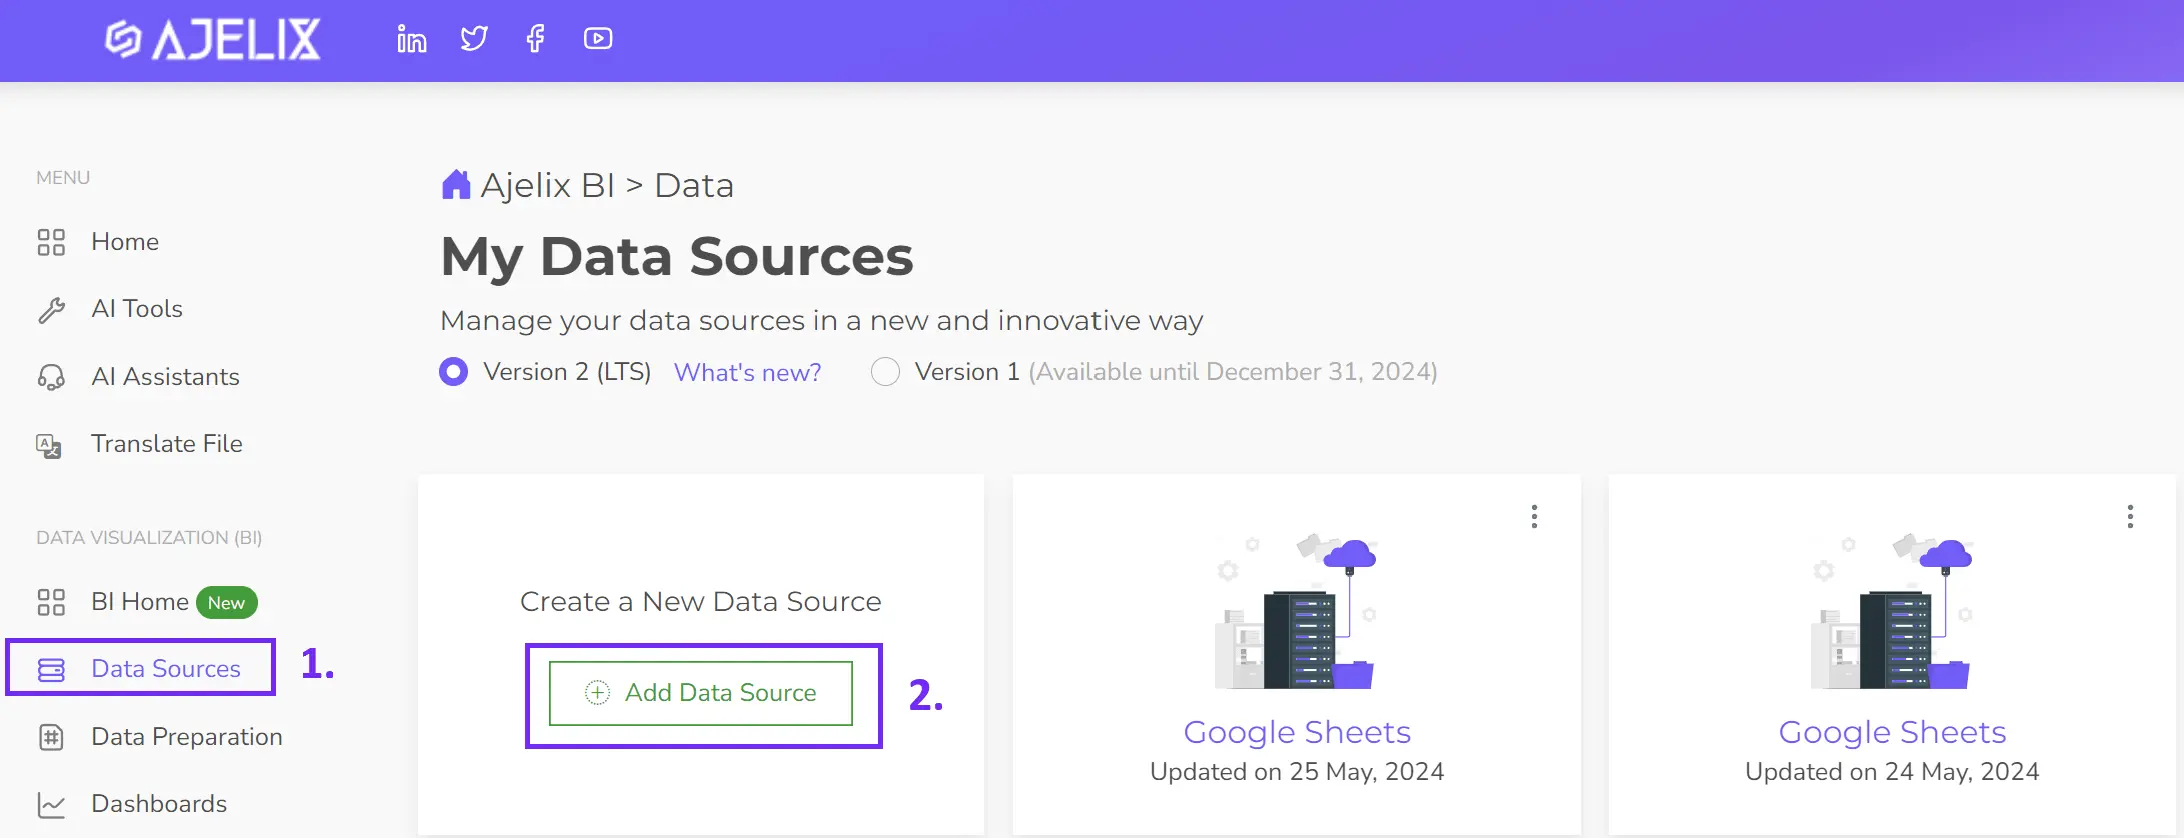
- Connect your data source
Add your data sources in the chosen BI tool, if you use Ajelix BI you can simply upload your Excel, or CSV, file or connect with a Google Sheets file or SQL database.
- Clean and transform your data (optional)
For cleaner and more reliable analysis, Ajelix BI offers a data cleaning tool. This allows you to ensure your data is accurate and consistent (e.g., converting formats, filtering). While not always necessary, cleaning your data can significantly improve the quality of your insights.
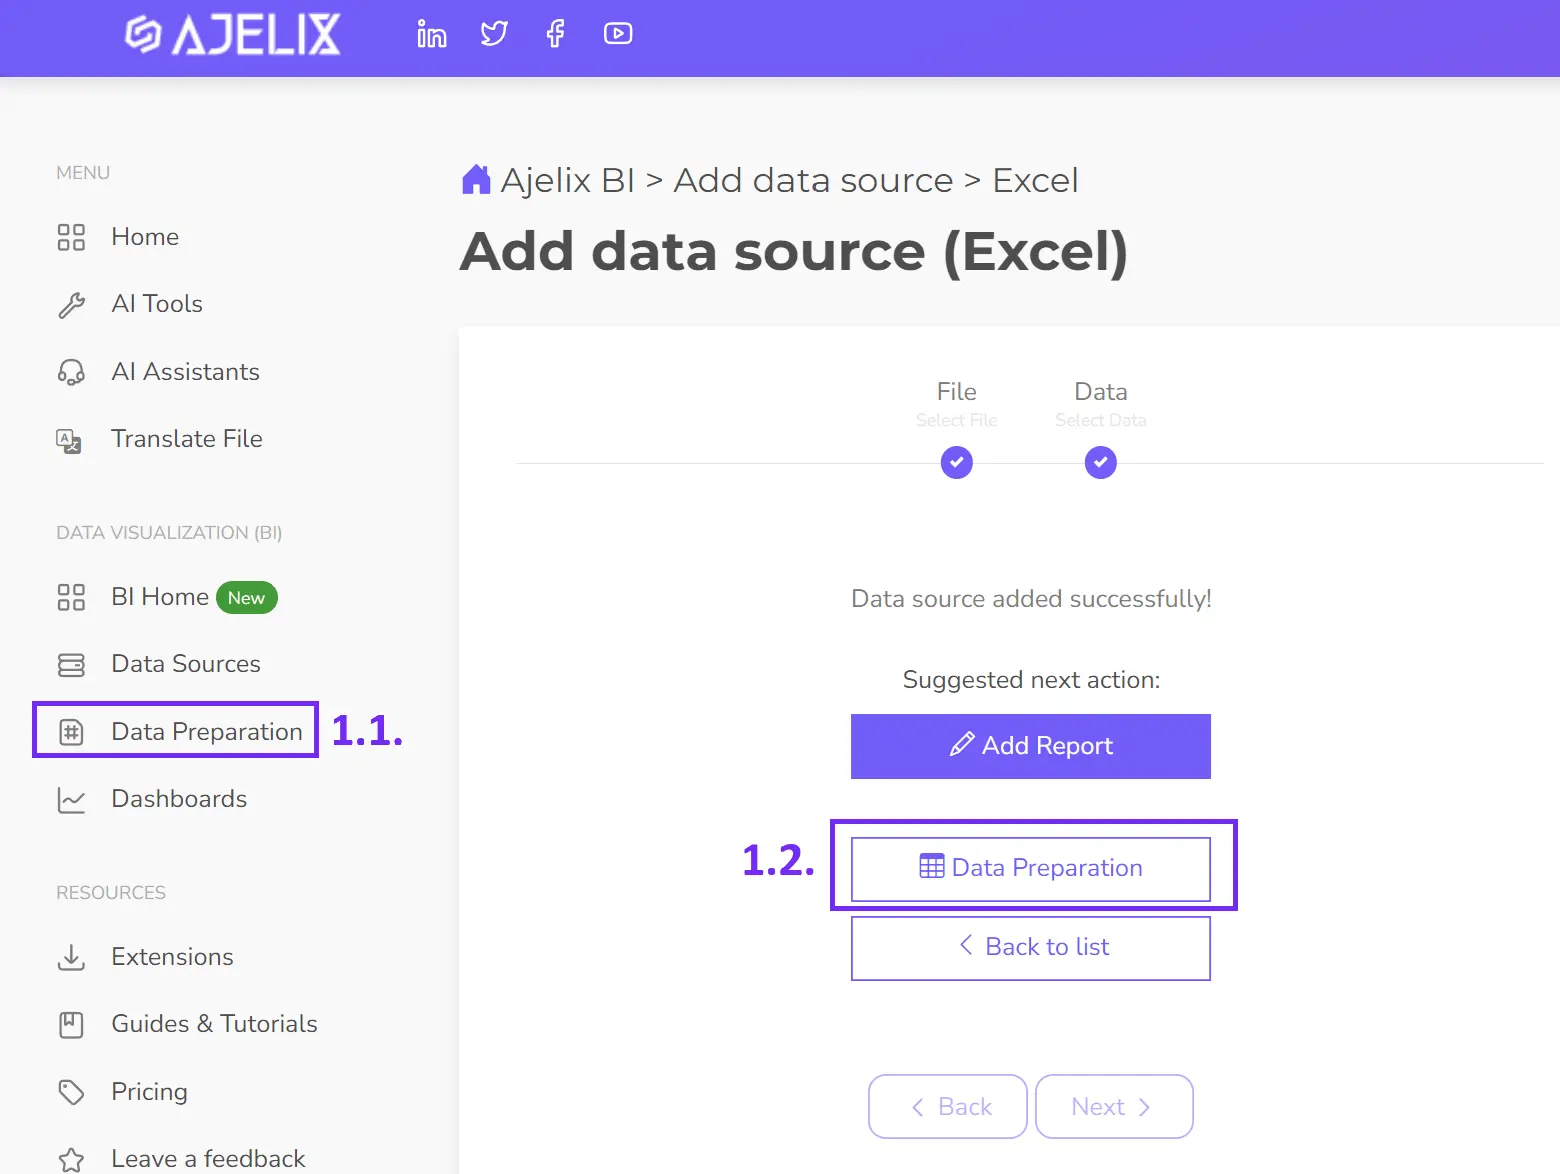
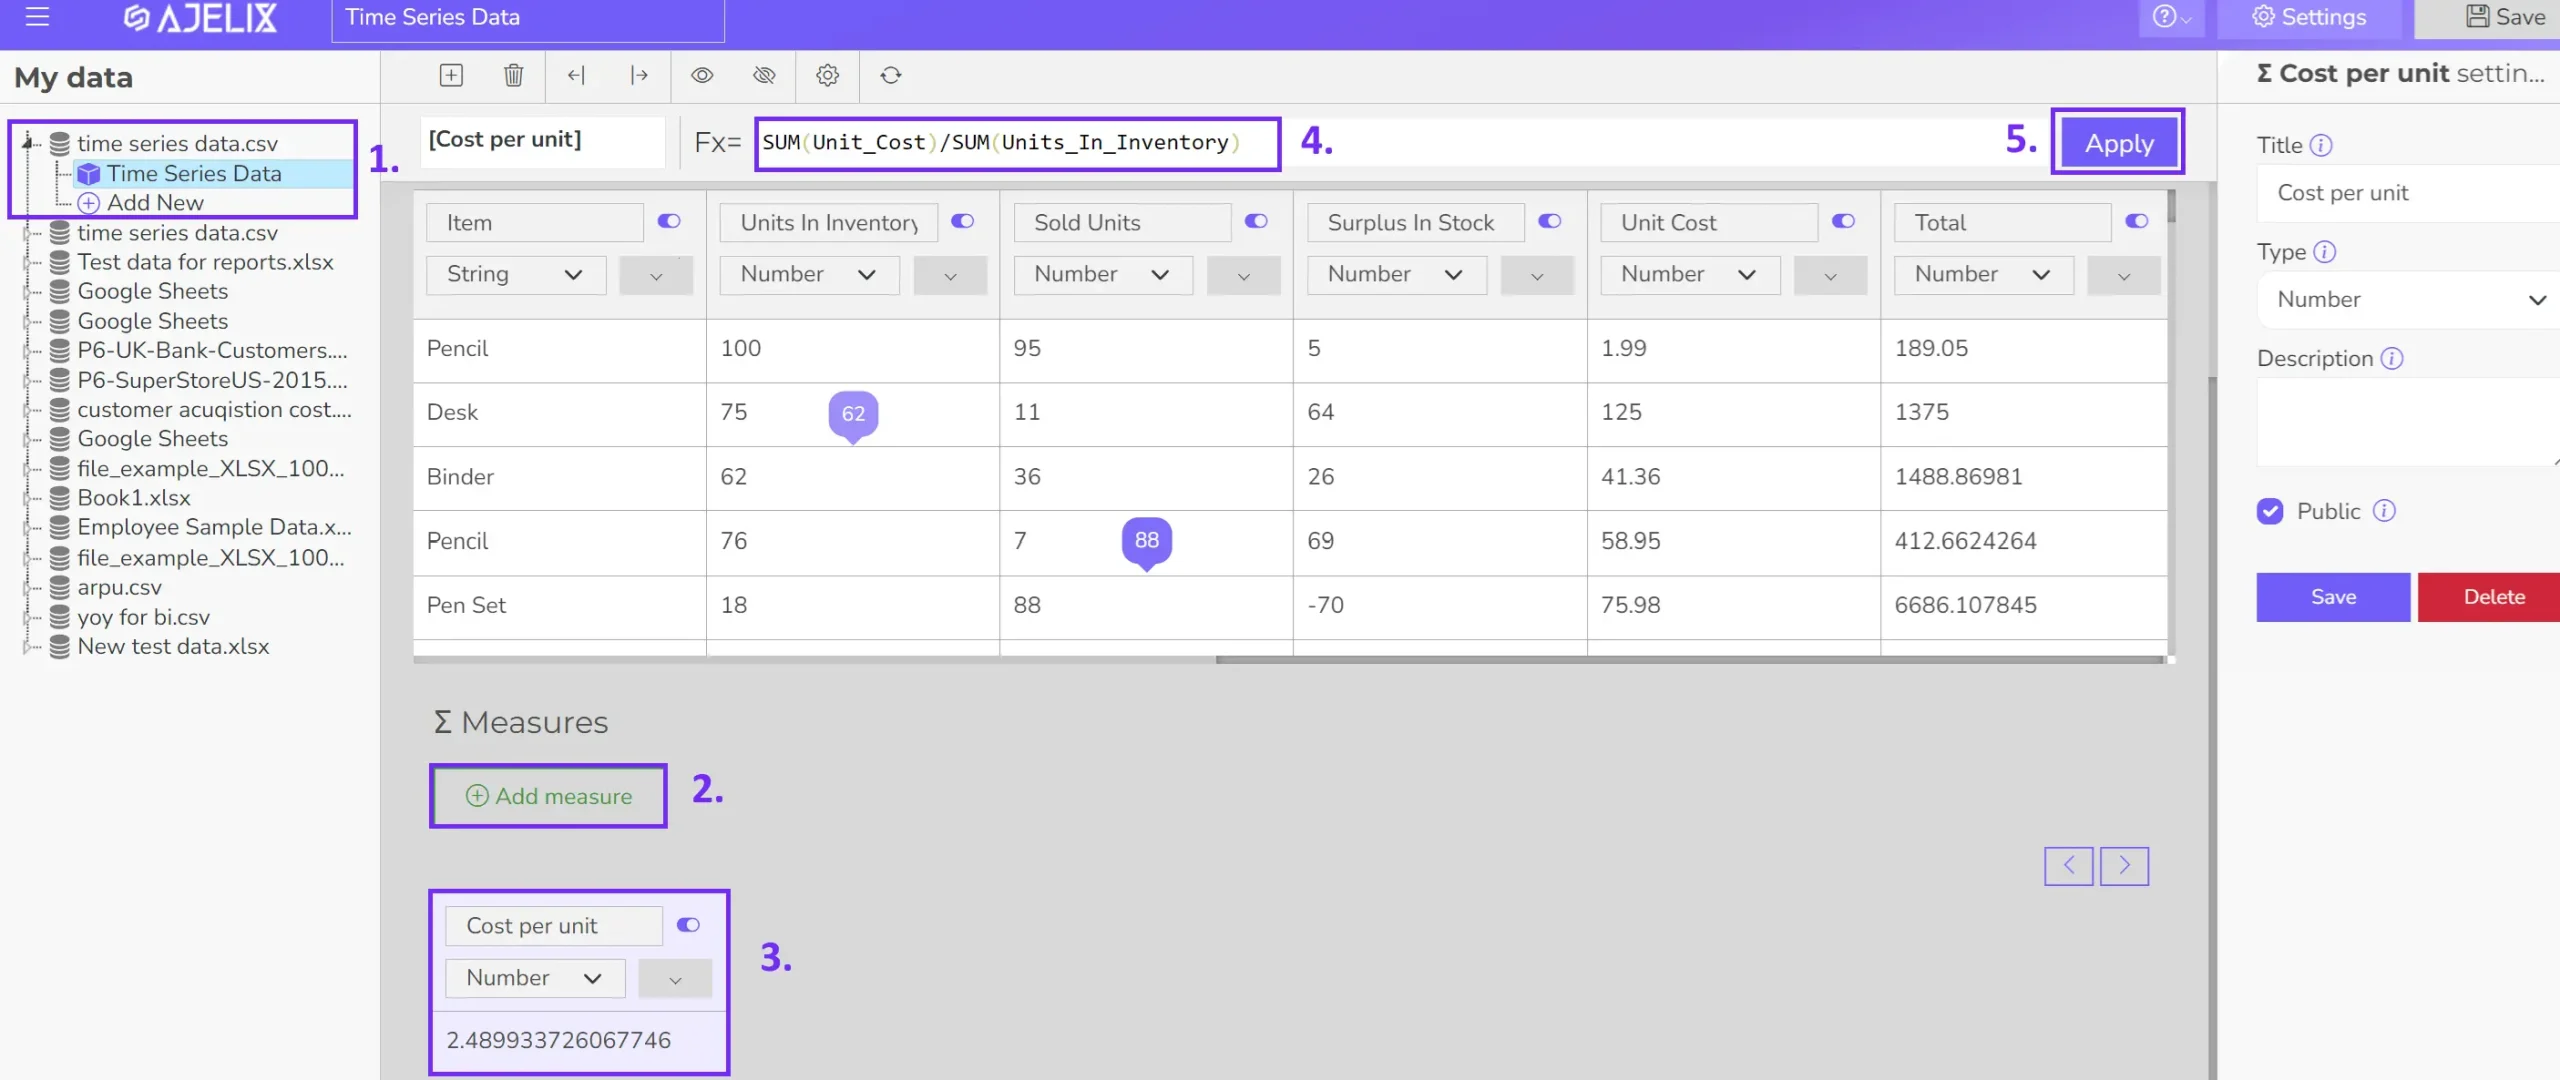
- Create calculated fields (optional)
Some KPIs might require calculations that your data source doesn’t provide directly. Calculate KPIs mentioned in this guide to track your e-commerce success! You can use these formulas along with Ajelix BI’s data modeling capabilities (pictured below) to create custom calculations and gain a more comprehensive understanding of your store’s performance.
- Build your visualizations
Select the most impactful visual format for each KPI. Consider options like cards for key numbers, gauges for progress tracking, or line graphs for trends over time. Ajelix BI offers a drag-and-drop visualization tool for easy customization.
Want to save even more time? Ajelix BI also features an AI-powered dashboard generator. Simply upload your data and let the AI create initial charts based on your information. It’s a great way to jumpstart your dashboard creation and see the “magic” of data visualization!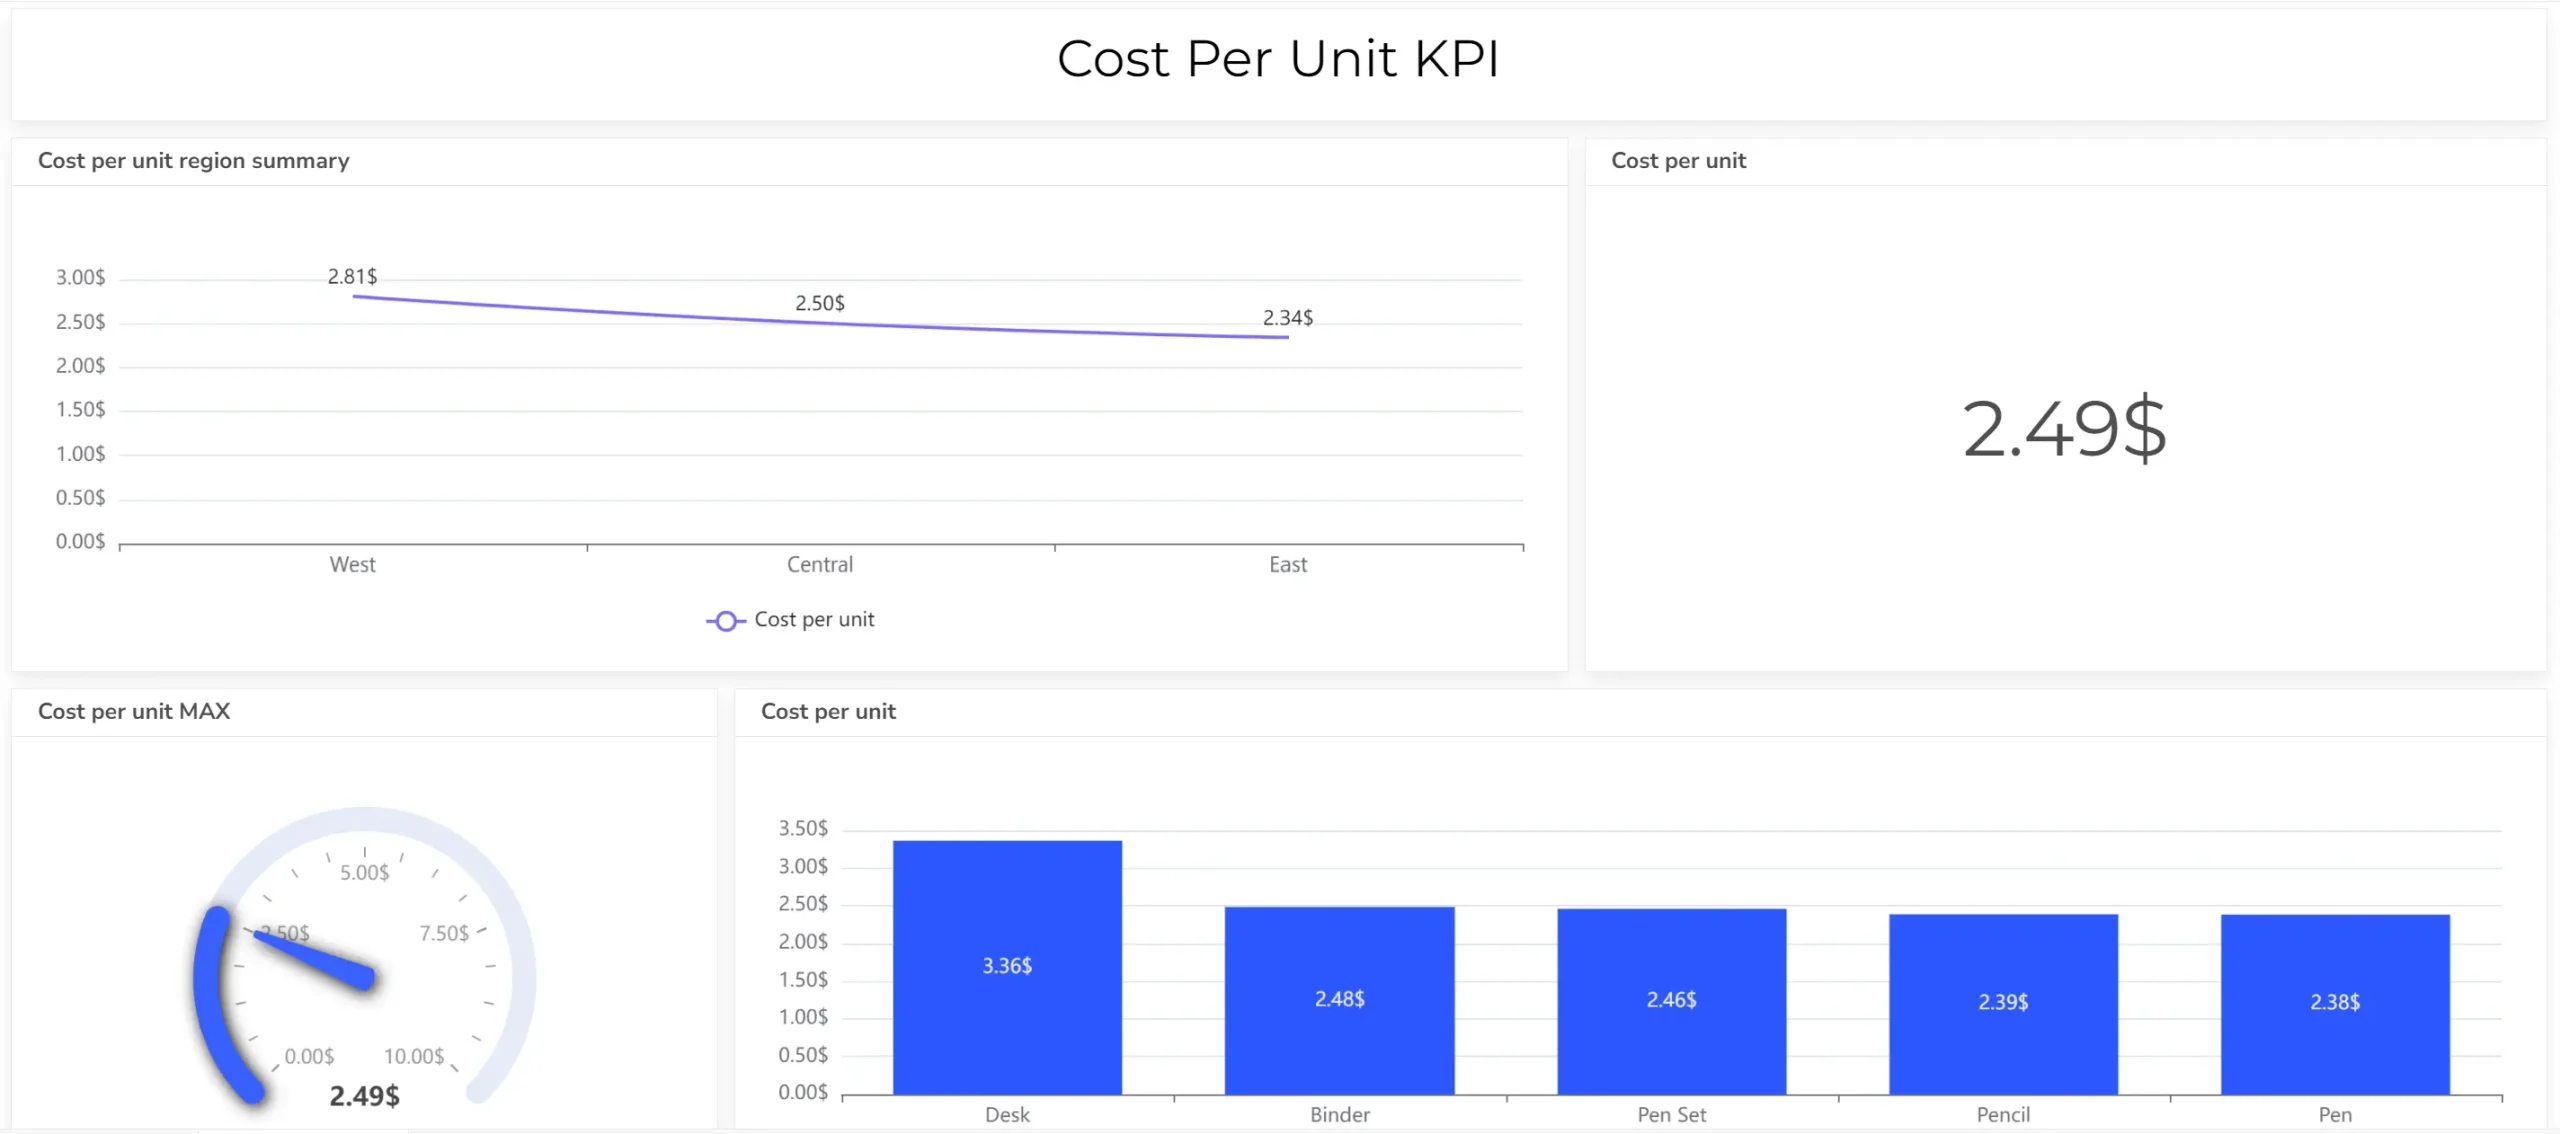
- Customize your dashboard
Add titles, and descriptions, and format the layout for clarity and visual appeal.
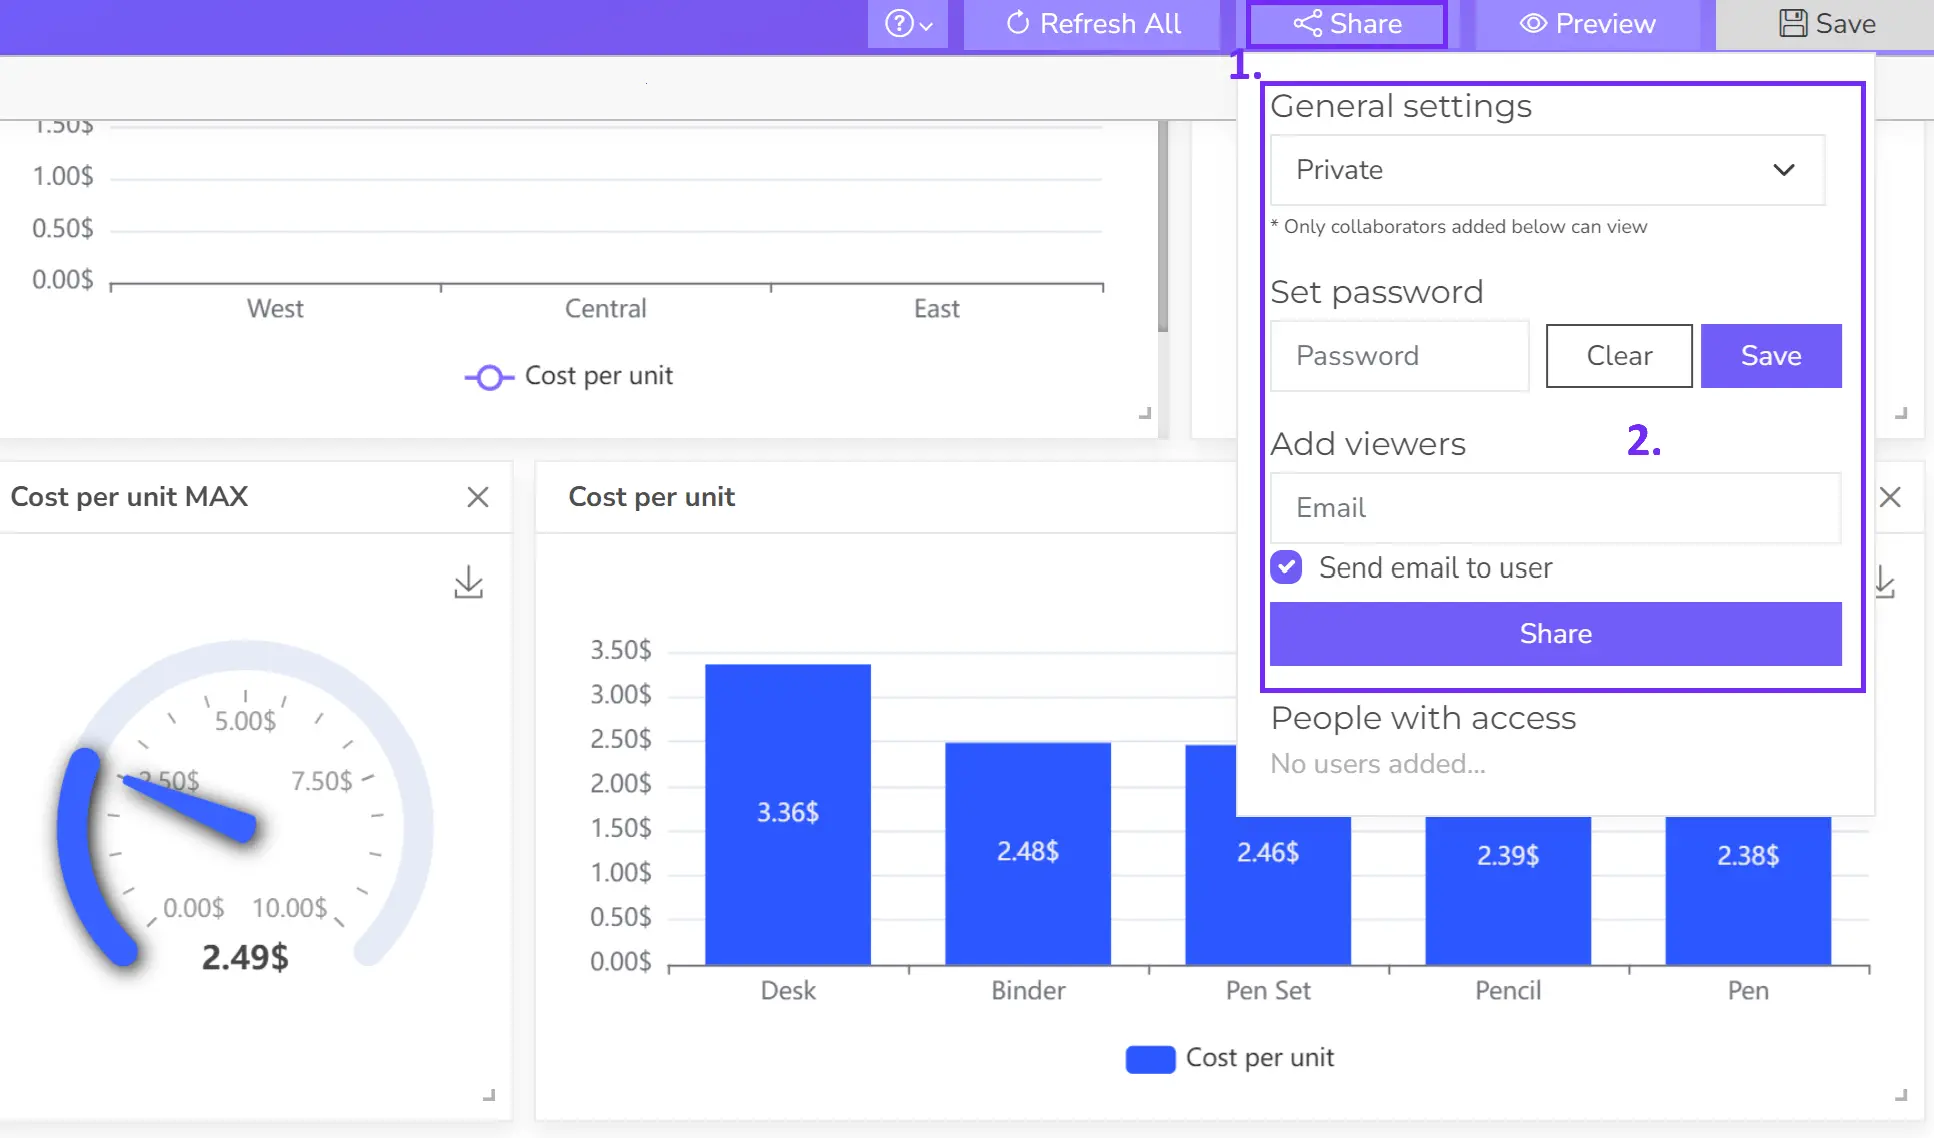
- Share your dashboard
Once happy, publish your dashboard and share it with relevant users for real-time insights.
Before you get started, consider these key steps:
- Define your KPIs: Identify the most important metrics that align with your e-commerce goals. Focus on a manageable number (around 5-10) for a clear and actionable dashboard.
- Gather and organize your data: Ensure your data is accurate and well-structured. This might involve connecting to data sources like databases, spreadsheets, or cloud storage.
- Choose a Business Intelligence (BI) tool: Many BI tools offer free trials or tiered plans to fit your needs. Popular options include Power BI, Looker Studio, Zoho Analytics, and Ajelix BI.
Reporting gives you a headache?
Upload your data and create professional reports with agentic AI

Start free
Try free and upgrade whenever
Conclusions
Remember, KPIs are only valuable if you use them to take action. By consistently monitoring and analyzing these metrics, you can make data-driven decisions to optimize your e-commerce store, enhance the customer experience, and ultimately drive long-term success.
FAQ
The ideal frequency for tracking KPIs depends on the specific metric and your business needs. High-impact metrics like daily sales, website traffic, and conversion rates deserve your close attention, so monitor them daily. For KPIs that reveal trends, such as bounce rate and average order value, weekly or bi-weekly monitoring is sufficient.
Without tracking KPIs, you’re flying blind in e-commerce. You won’t know what’s working, what’s not, or if your efforts are paying off. This can lead to wasted resources, missed opportunities, and difficulty achieving your business goals.
To improve your cart abandonment rate, focus on streamlining checkout, offering clear return policies, and potentially adding features like cart reminders or guest checkout options.
The key difference is that conversion rate can be tailored to track any desired action, while hit rate usually refers to sales specifically. Conversion rate focuses on a specific desired action, like a purchase. It’s the percentage of visitors who complete that action. Hit rate can have broader interpretations, but in e-commerce, it often refers to the percentage of visitors who make a purchase (similar to conversion rate).
E-commerce businesses looking for free or affordable BI tools have several options, including:
Freemium options: Ajelix BI, Looker Studio (limited features), Free trials: Power BI, Tableau (limited timeframe), Open-source options: Apache Druid, Metabase (may require some technical expertise)
From data to report in one minute or less with Ajelix BI