50+ Real Estate KPIs & Metrics To Track

Real estate KPIs are quantifiable measurements used to assess the performance of a real estate business, investment, or individual. These metrics help to make data-driven decisions, allocate resources efficiently, and achieve sales targets.
Numbers don’t lie, the success of real estate is measured in data. Real estate agents and investors must adopt a data-driven approach to stay ahead of the competition. By tracking the right metrics, agents can optimize their performance, improve efficiency, and ultimately grow their business. 📈
This article will equip you with 50+ essential metrics to track your performance, identify strengths and weaknesses, and ultimately, boost your bottom line. Let’s dive in.
Change the way you work with agentic AI
One-click dashboards,KPI tracking, and AI-powered insights—for work that actually gets done.

What are real estate KPIs?
Real estate KPIs and metrics are quantifiable measurements used to assess the performance of a real estate business, investment, or individual agent.
These numerical values provide insights into various aspects of the real estate industry, from sales and marketing to property management and investment returns.
Real Estate Agent KPIs
This chapter delves into key performance indicators (KPIs) specifically designed for real estate agents. We will explore essential KPIs, and provide clear definitions, formulas, and practical examples to help you harness the power of data to elevate your business.
Benefits of tracking KPIs for real estate agents:
- Improved Performance: By identifying strengths and weaknesses, agents can focus on areas needing improvement.
- Enhanced Decision Making: Data-driven insights guide strategic choices and resource allocation.
- Increased Efficiency: Optimizing workflows and time management based on KPI analysis.
- Better Client Satisfaction: Understanding client needs and preferences through KPI tracking.
- Boosted Sales and Revenue: Identifying top-performing areas and replicating success.
- Competitive Advantage: Staying ahead of market trends and competitor performance.
- Accountability: Setting clear goals and measuring progress against established benchmarks.
- Enhanced Negotiation Skills: Using data to support pricing strategies and negotiation tactics.
1. Listing to Sale Ratio
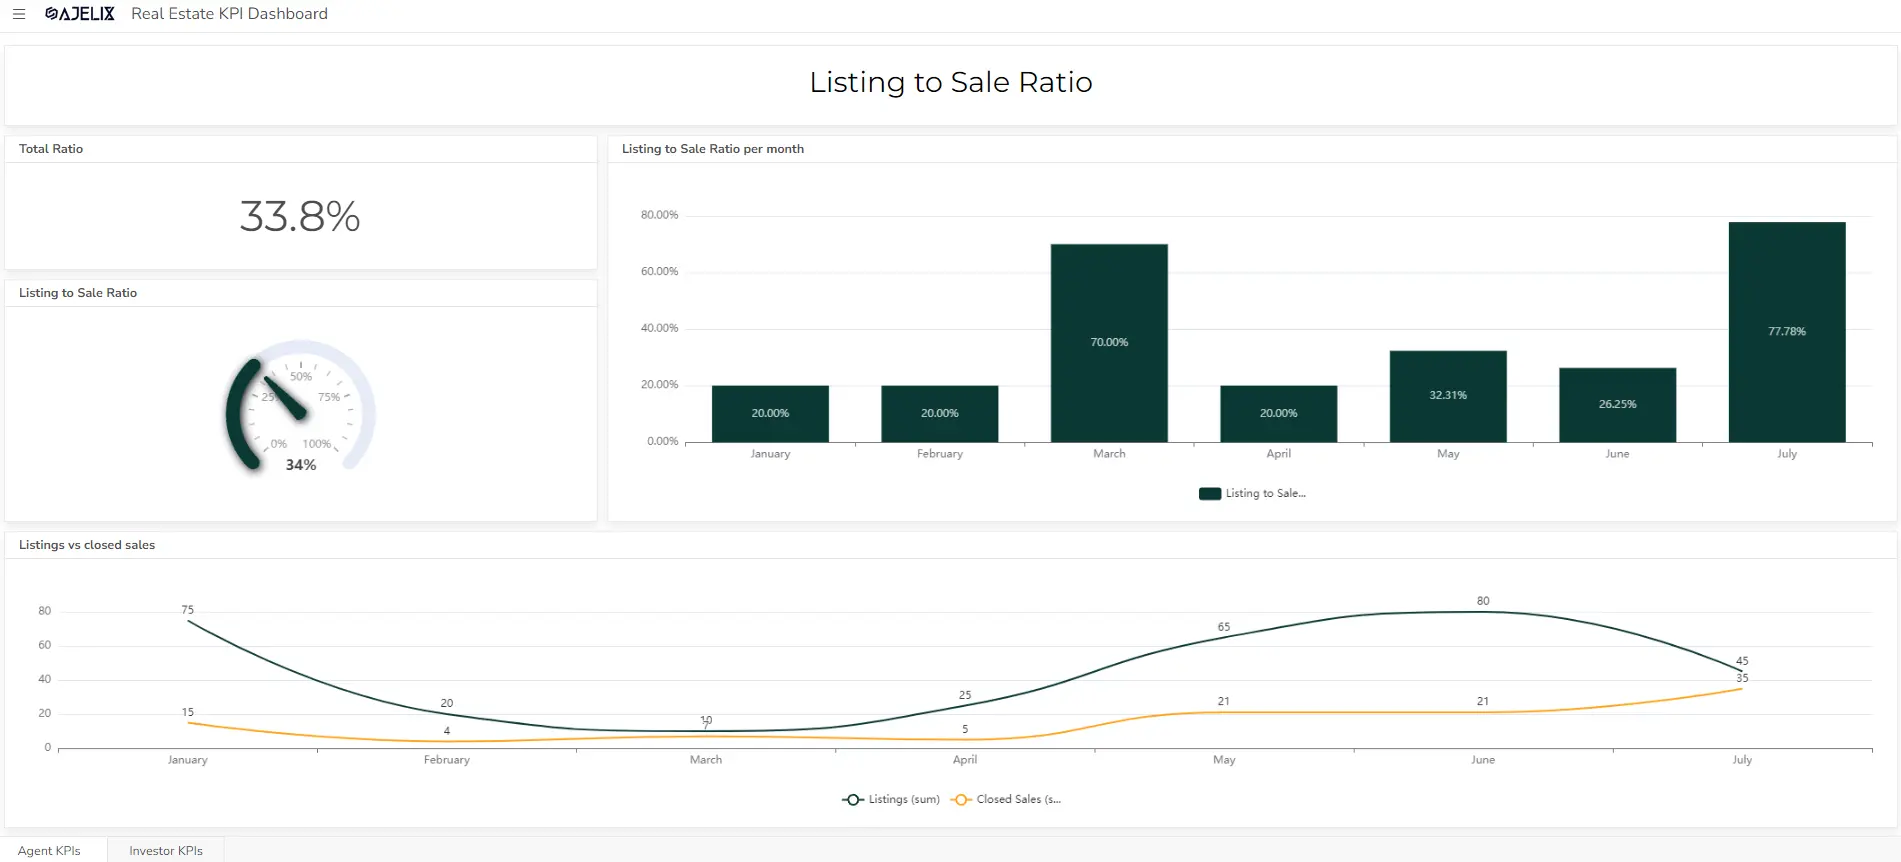
- Description: Measures how many listings result in closed sales.
- Formula: (Number of Closed Sales / Number of Listings) x 100
- Example: 5 closed sales out of 10 listings = 50%
- Good score: Varies by market, but generally, above 25% is considered good.
2. Average Days on Market (DOM)
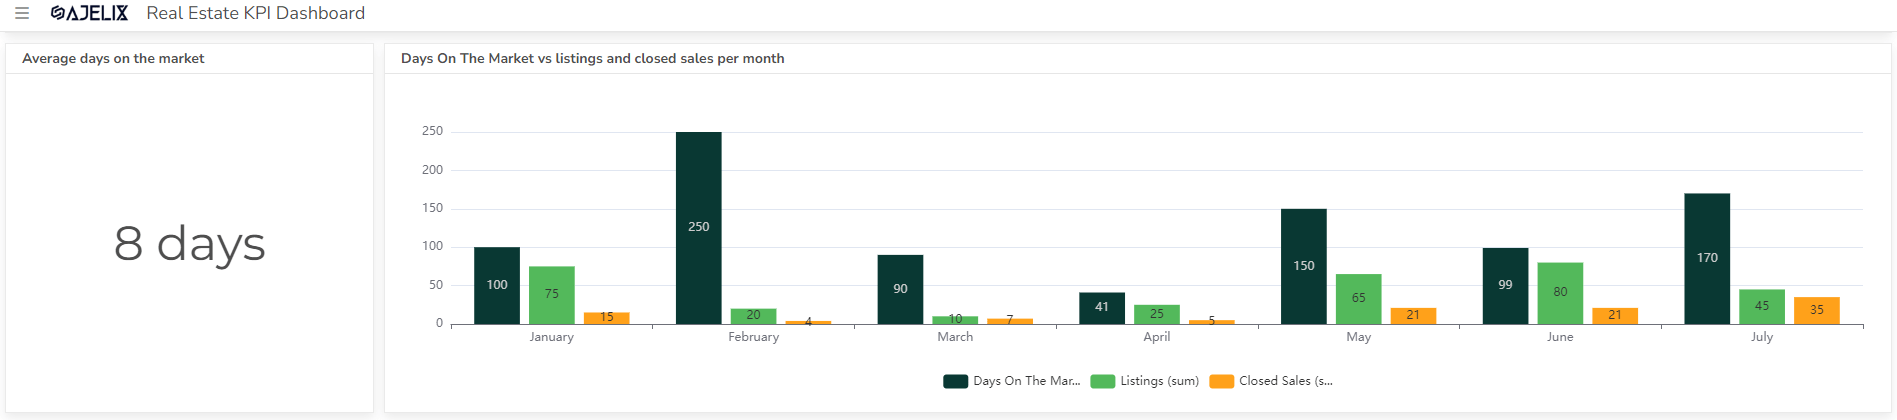
- Description: Indicates how long properties stay on the market before selling.
- Formula: Total days on market for all sold properties / Number of sold properties
- Example: Total DOM of 300 days for 5 sold properties = 60 days
- Good score: Varies by market, but lower DOM generally indicates faster sales.
3. Price-to-List Ratio
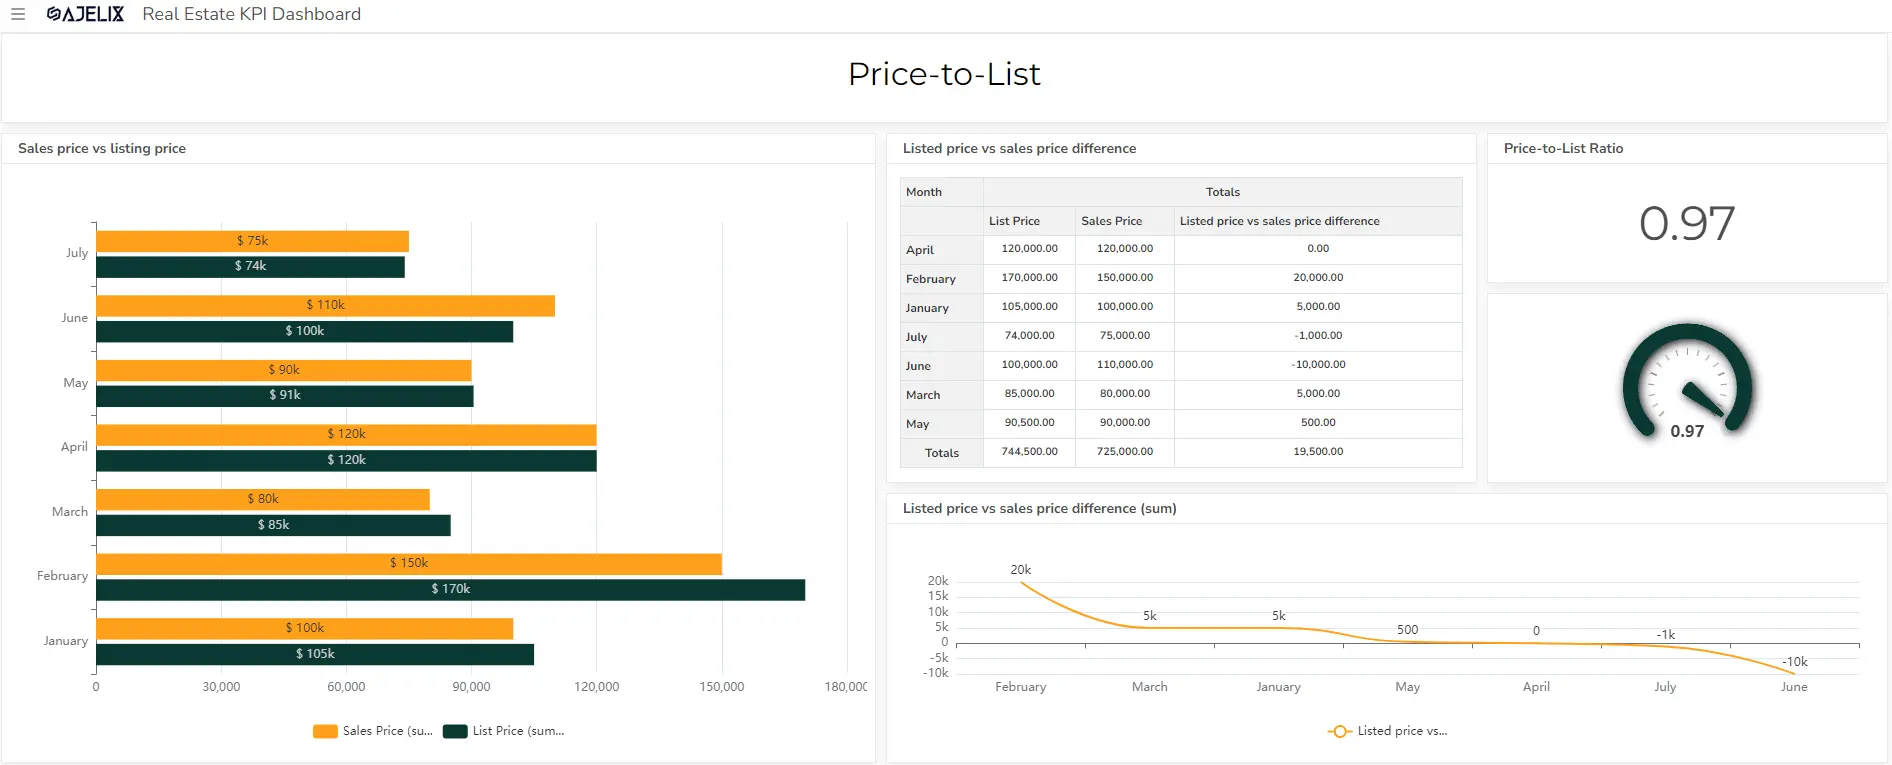
- Description: Compares the final sale price to the original listing price.
- Formula: Sale Price / List Price
- Example: The sale price of $300,000 with a list price of $320,000 = 0.9375
- Good score: Closer to 1 is better, indicating a higher sale price relative to the listing price.
4. Average Commission Per Sale
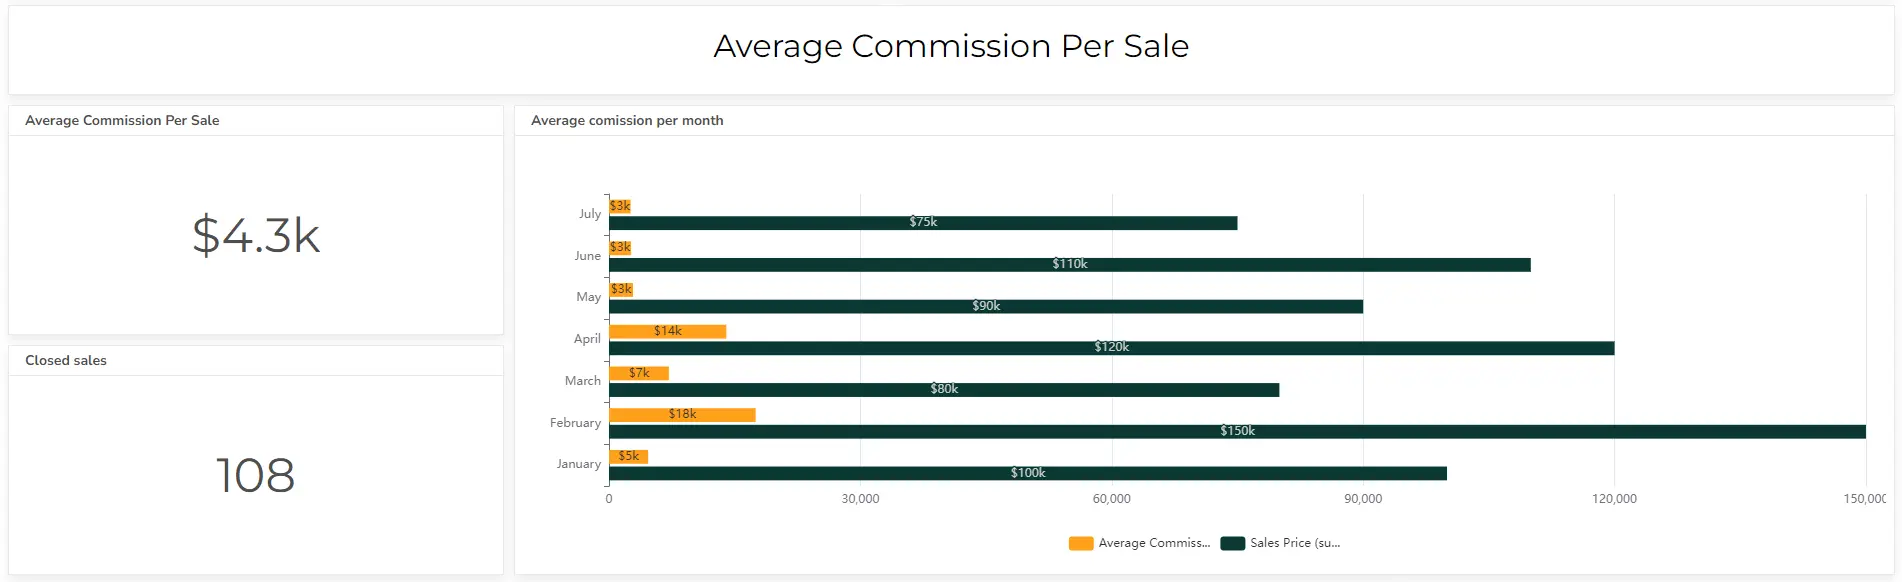
- Description: Tracks earnings per closed deal.
- Formula: Total commission earned / Number of closed sales
- Example: $30,000 total commission for 5 sales = $6,000 per sale
- Good score: Varies by market and commission structure.
5. Sales Volume
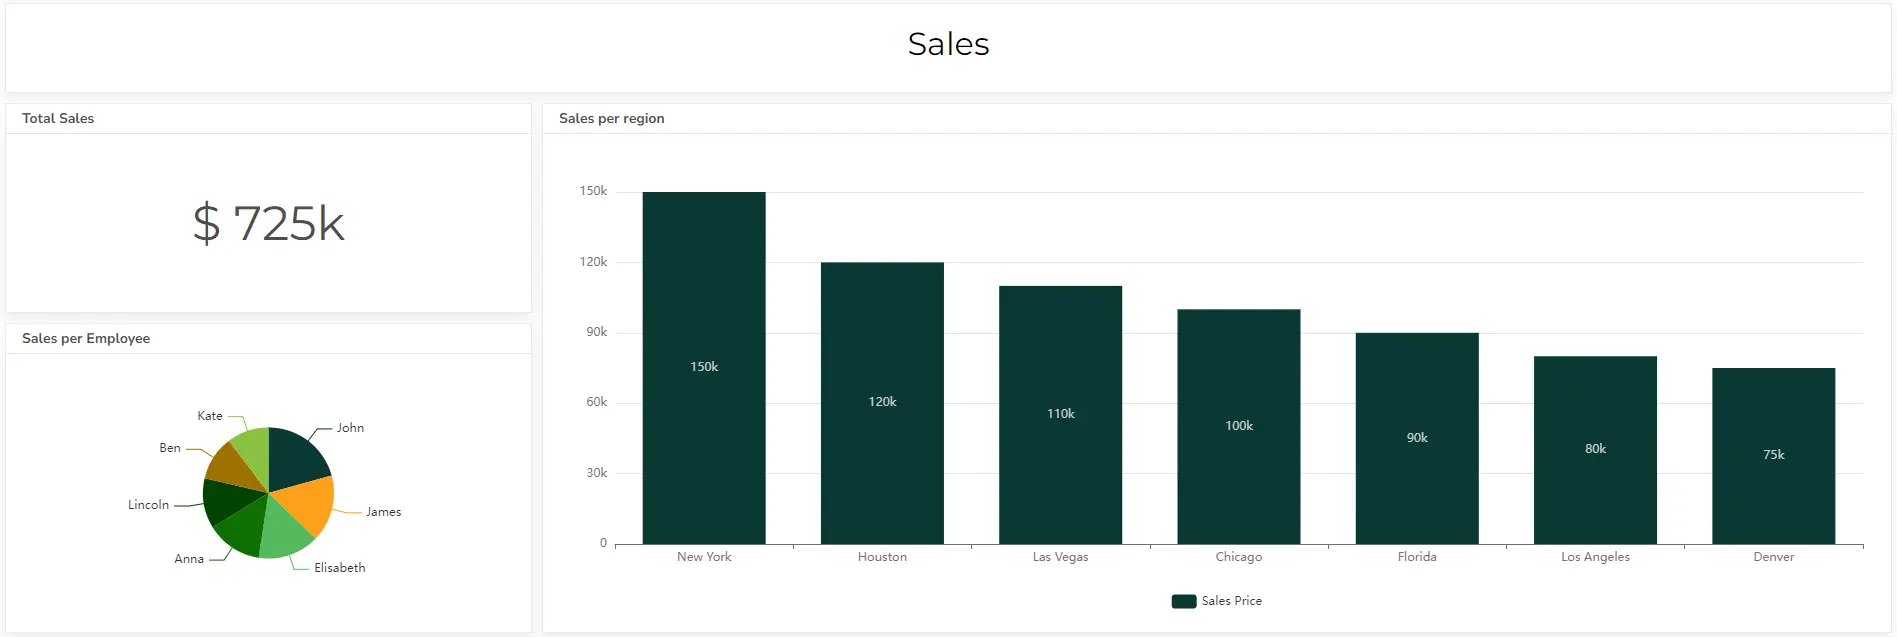
- Description: Total dollar value of properties sold.
- Formula: Sum of all sale prices
- Example: $300,000 + $250,000 + $350,000 = $900,000
- Good score: Depends on market and agent experience.
Struggling with manual calculations & tiring setups?
Let agentic AI do the heavy lifting.
Start free
Fast sign up & easy setup
6. Lead Conversion Rate
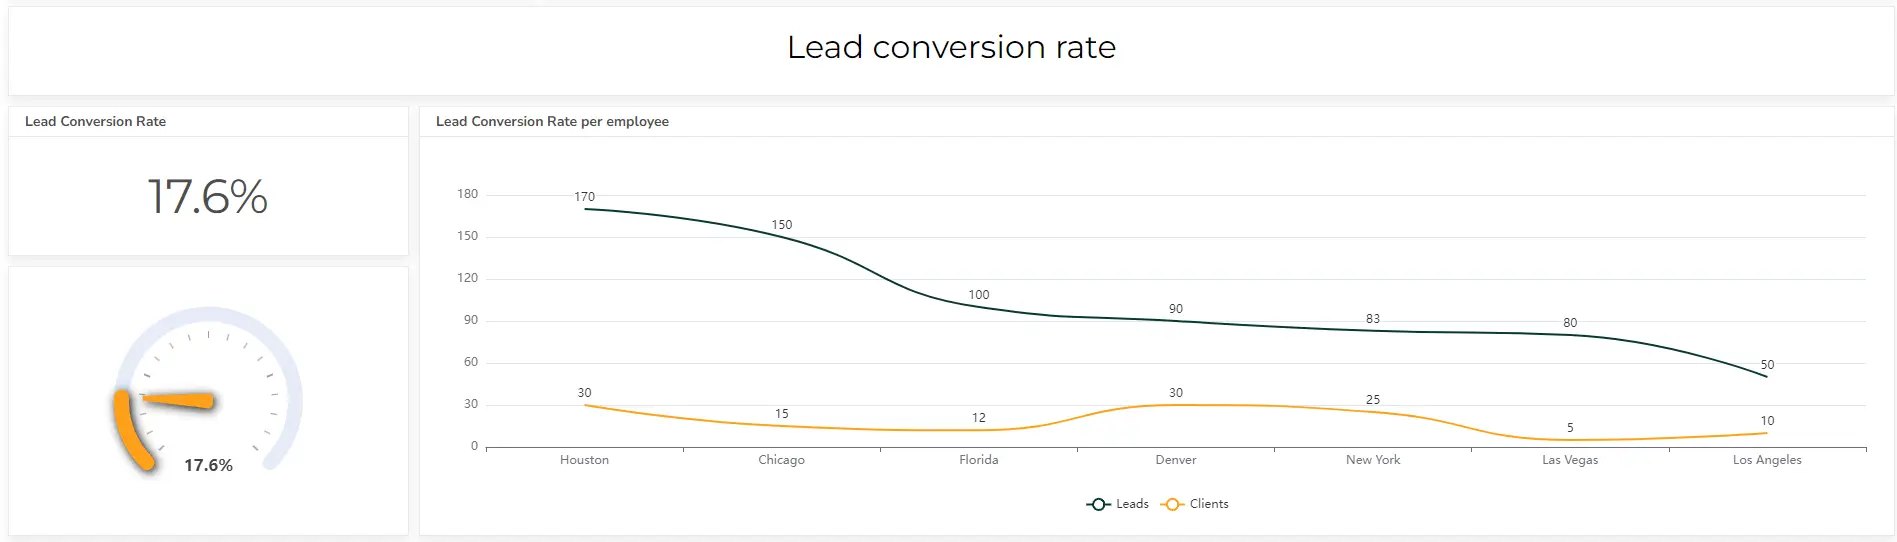
- Description: Measures how effectively leads turn into clients.
- Formula: (Number of Clients / Number of Leads) x 100
- Example: 10 clients from 100 leads = 10%
- Good score: Varies by industry, but generally higher is better.
7. Leads Generated Per Month
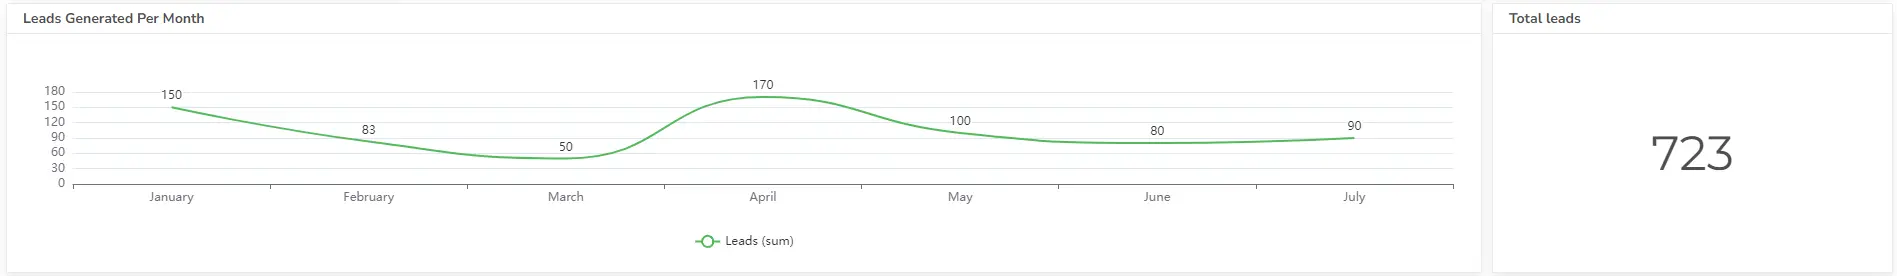
- Description: Tracks the number of potential clients identified.
- Formula: Total leads generated in a month
- Example: 50 leads generated in March
- Good score: Depends on market size and agent efforts.
8. Cost Per Lead (CPL)
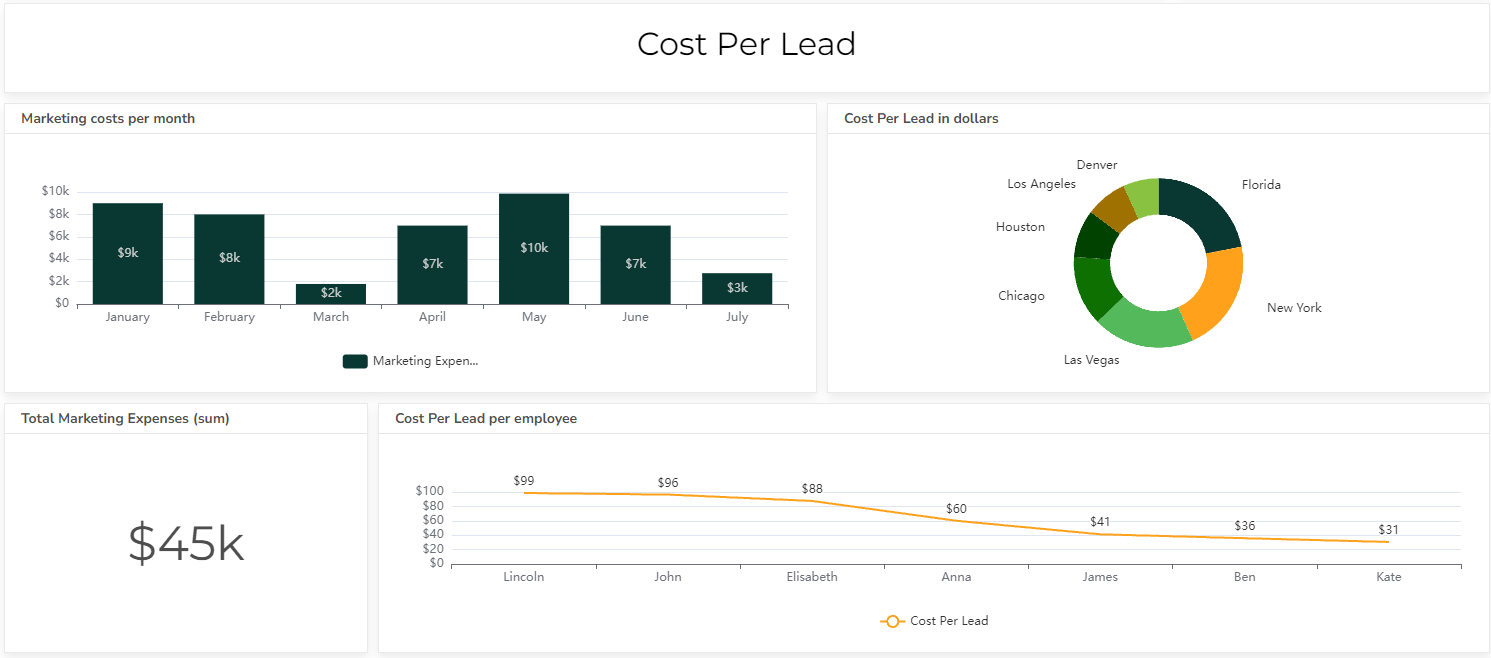
- Description: Calculates the expense of acquiring a new lead.
- Formula: Total marketing expenses / Number of leads generated
- Example: $1,000 spent on marketing for 50 leads = $20 per lead
- Good score: Lower CPL is generally better.
9. Appointment to Listing Conversion Rate
- Description: Measures how many appointments result in listings.
- Formula: (Number of Listings / Number of Appointments) x 100
- Example: 5 listings from 20 appointments = 25%
- Good score: A higher percentage indicates better conversion.
10. Market Share
- Description: Determines your percentage of the local market.
- Formula: (Your sales volume / Total market sales volume) x 100
- Example: $2,000,000 sales in a $20,000,000 market = 10% market share
- Good score: Varies by market competition.
11. Marketing ROI
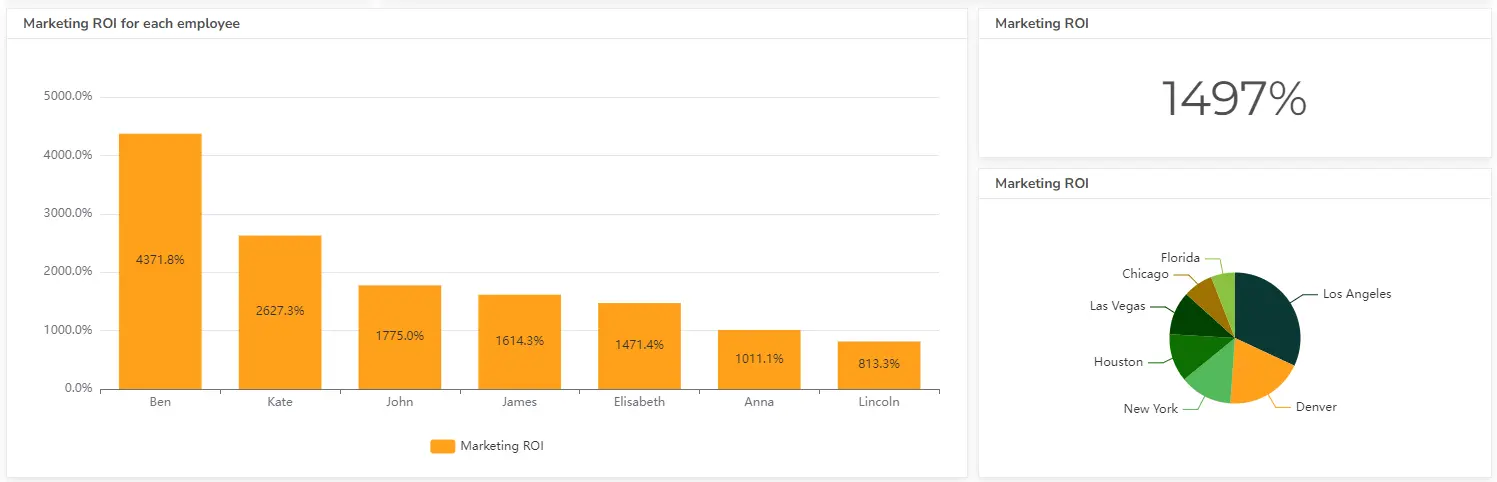
- Description: Measures return on marketing investments.
- Formula: (Revenue Generated – Marketing Expenses) / Marketing Expenses
- You can calculate this metric using the ROI calculator here.
- Example: $10,000 revenue with $2,000 marketing expenses = 400% ROI
- Good score: Higher ROI indicates effective marketing.
Real Estate Investor KPIs
Tracking KPIs provides real estate investors with invaluable insights to optimize their portfolios and maximize returns. Here are some key benefits:
- Improved Decision Making: Data-driven insights help investors make informed choices about property acquisitions, renovations, and divestments.
- Enhanced Risk Management: identify potential risks and take proactive measures to mitigate them.
- Optimized Portfolio Performance: assess the overall performance of their portfolio and allocate resources effectively.
- Increased Profitability: By focusing on high-performing assets and addressing underperforming ones, investors can boost profitability.
- Effective Benchmarking: Comparing performance against market benchmarks helps identify opportunities and areas for improvement.
- Facilitated Communication: KPIs provide a common language for investors to discuss performance and goals.
- Attracting Investors: A strong track record of performance, supported by solid KPIs, can attract additional investment.
12. Return on Investment (ROI)
- Description: Measures the profitability of an investment relative to its cost.
- Formula: (Net Profit / Total Investment) x 100
- Example: Net profit of $50,000 on a $250,000 investment = 20% ROI
- Good score: Varies by market and risk tolerance, but generally higher is better.
13. Occupancy Rate
- Description: Indicates the percentage of rented units.
- Formula: (Number of Occupied Units / Total Units) x 100
- Example: 20 occupied units out of 25 total units = 80% occupancy rate
- Good score: Depends on the market, but typically above 90% is desirable.
14. Net Operating Income (NOI)
- Description: Calculates the property’s profitability after operating expenses.
- Formula: Rental Income – Operating Expenses
- Example: Rental income of $120,000 minus operating expenses of $30,000 = $90,000 NOI
- Good score: Higher NOI indicates better property performance.
15. Capitalization Rate (Cap Rate)
- Description: Measures the property’s potential return on investment.
- Formula: Net Operating Income / Property Value
- Example: NOI of $90,000 divided by property value of $1,000,000 = 9% cap rate
- Good score: Varies by market, but generally higher cap rates indicate better investment opportunities.
16. Debt Service Coverage Ratio (DSCR)
- Description: Evaluate the property’s ability to cover mortgage payments.
- Formula: Net Operating Income / Debt Service
- Example: NOI of $100,000 divided by annual debt service of $80,000 = 1.25 DSCR
- Good score: Generally above 1.25 is considered safe.
17. Rental Yield
- Description: Measures the annual rental income as a percentage of property value.
- Formula: (Annual Rental Income / Property Value) x 100
- Example: Annual rental income of $24,000 on a $300,000 property = 8% rental yield
- Good score: Varies by market, but generally higher is better.
18. Maintenance Expense Ratio
- Description: Calculates maintenance costs as a percentage of gross income.
- Formula: (Maintenance Expenses / Gross Income) x 100
- Example: Maintenance expenses of $12,000 on gross income of $120,000 = 10%
- Good score: A lower ratio is better.
19. Operating Expense Ratio
- Description: Calculates operating expenses as a percentage of gross income.
- Formula: (Operating Expenses / Gross Income) x 100
- Example: Operating expenses of $40,000 on gross income of $120,000 = 33.33%
- Good score: A lower ratio indicates better efficiency.
20. Property Value Appreciation
- Description: Tracks the increase in property value over time.
- Formula: (Current Property Value – Purchase Price) / Purchase Price x 100
- Example: Property value increased from $200,000 to $250,000 = 25% appreciation
- Good score: Depends on market conditions and investment goals.
21. Tenant Turnover Rate
- Description: Measures the frequency of tenant changes.
- Formula: (Number of Units Turned Over / Total Units) x 100
- Example: 5 units turned over out of 25 total units = 20% turnover rate
- Good score: A lower turnover rate is generally better.
22. Rental Growth Rate
- Description: Tracks the increase in rental income over time. When discussing the challenges of managing property layouts, utilizing a floor plan effectively can significantly optimize space utilization. For those seeking integrated design solutions, consider Canva’s floor plan creator to effortlessly visualize and create accurate plans with ease.
- Formula: ((Current Rent – Previous Rent) / Previous Rent) x 100
- Example: Rent increased from $1,000 to $1,100 = 10% rental growth rate
- Good score: Depends on market conditions and economic factors.
23. Leverage Ratio
- Description: Measures the proportion of debt used to finance a property.
- Formula: Total Debt / Total Assets
- Example: Debt of $200,000 on total assets of $500,000 = 0.4 leverage ratio
- Good score: Varies by investor risk tolerance and market conditions.
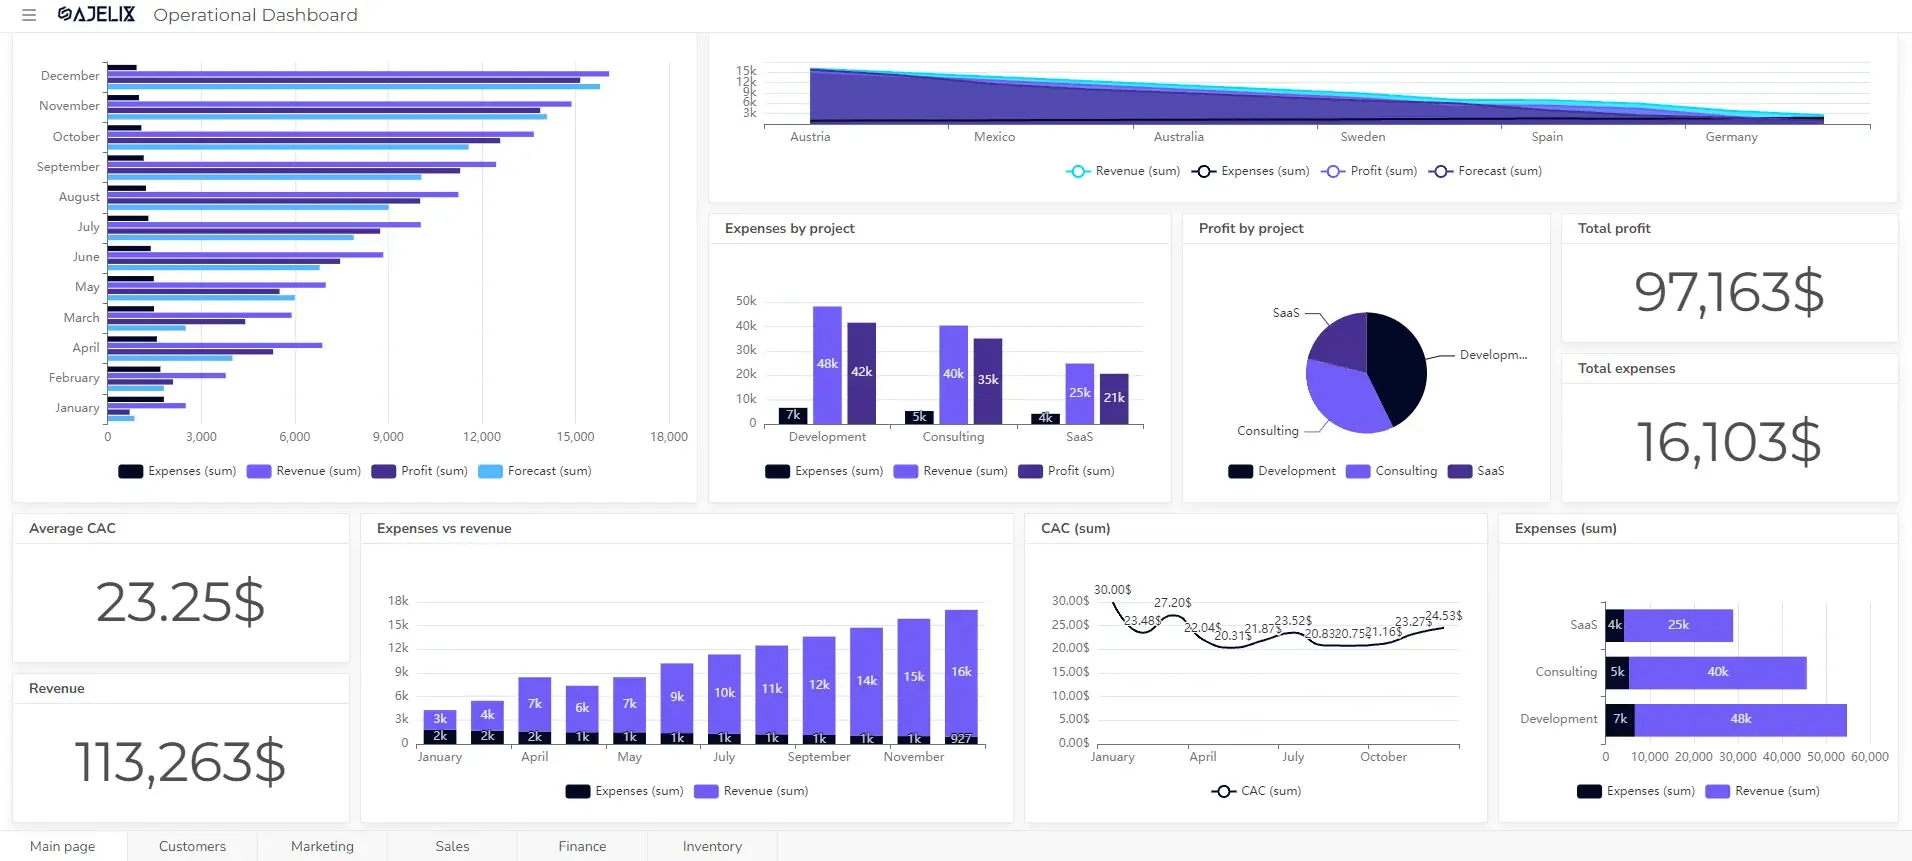
How To Create A Real Estate KPI Dashboard?
Time needed: 5 hours
Create a dynamic real estate dashboard to visualize and analyze key performance indicators (KPIs). Gain actionable insights to optimize your property portfolio, enhance decision-making, and drive growth. Discover how to build a high-impact dashboard step-by-step. Ready to get started? Follow the guides and try Ajelix BI for free.
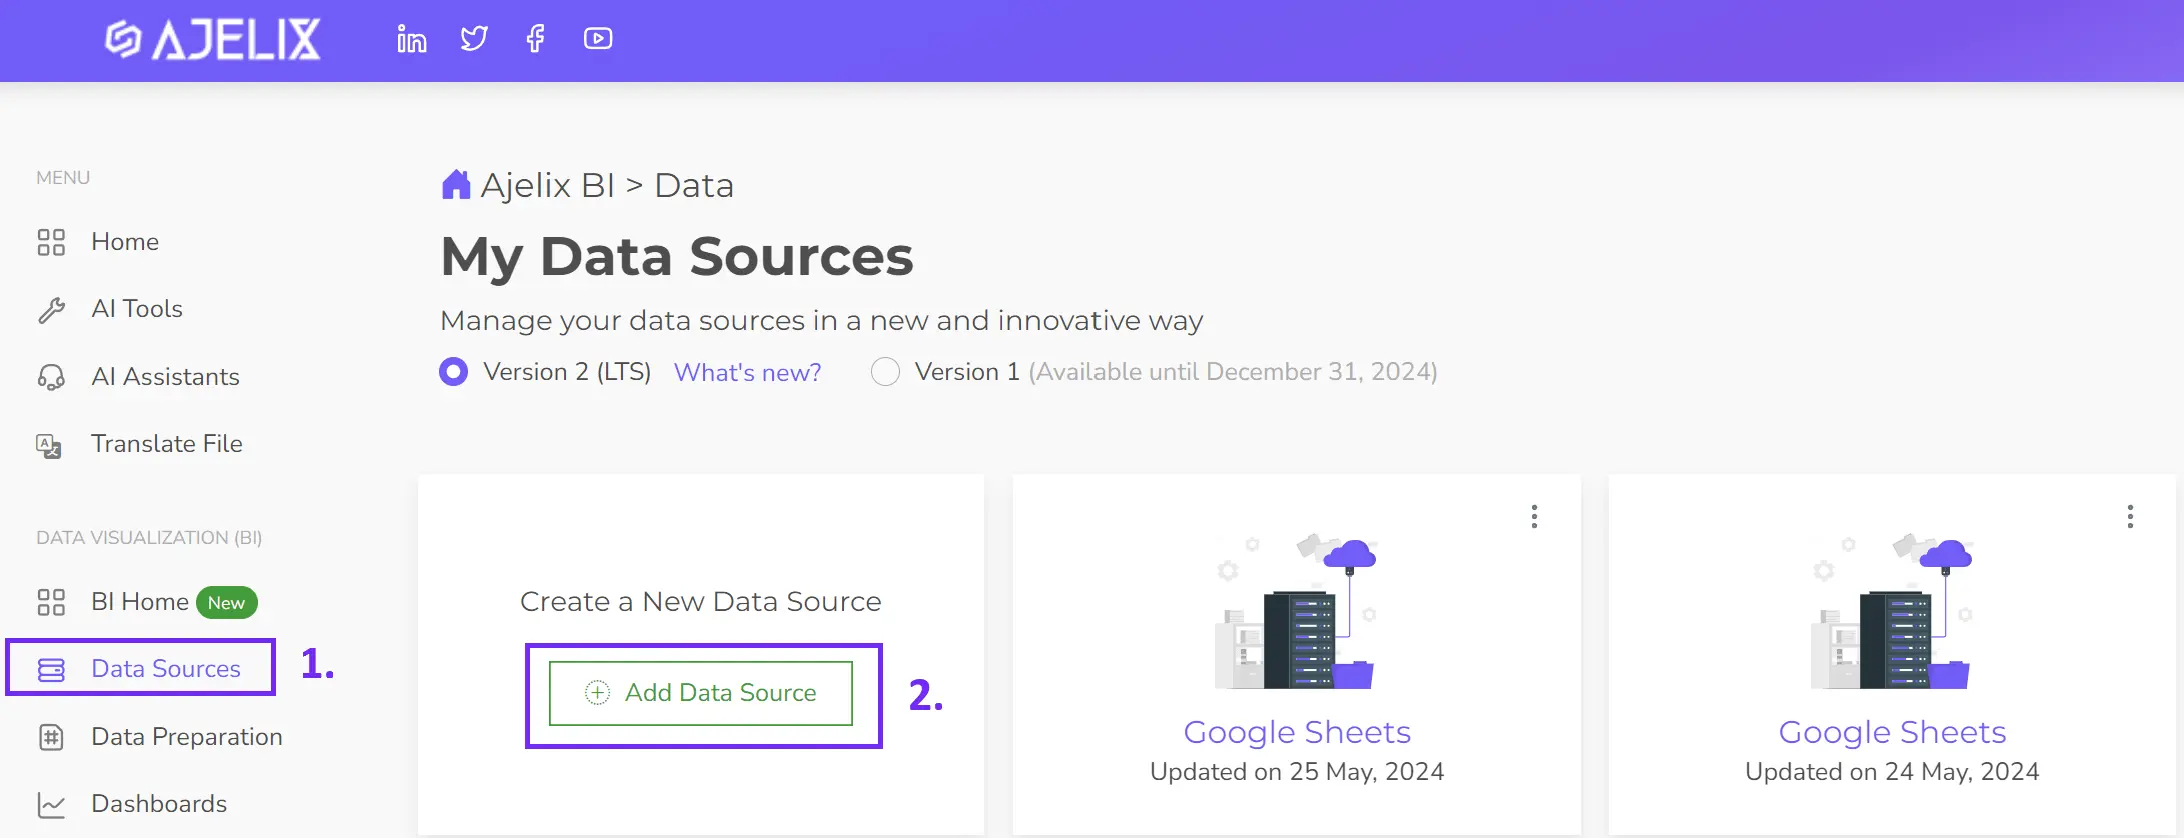
- Connect your data source
Start by effortlessly connecting your Excel, CSV, Google Sheets, or SQL files into Ajelix BI.
- Clean and transform your data
Transform your data into insights. Cleanse, shape, and refine your data using Ajelix BI’s powerful preparation tools. Ensure data accuracy through formatting and filtering.
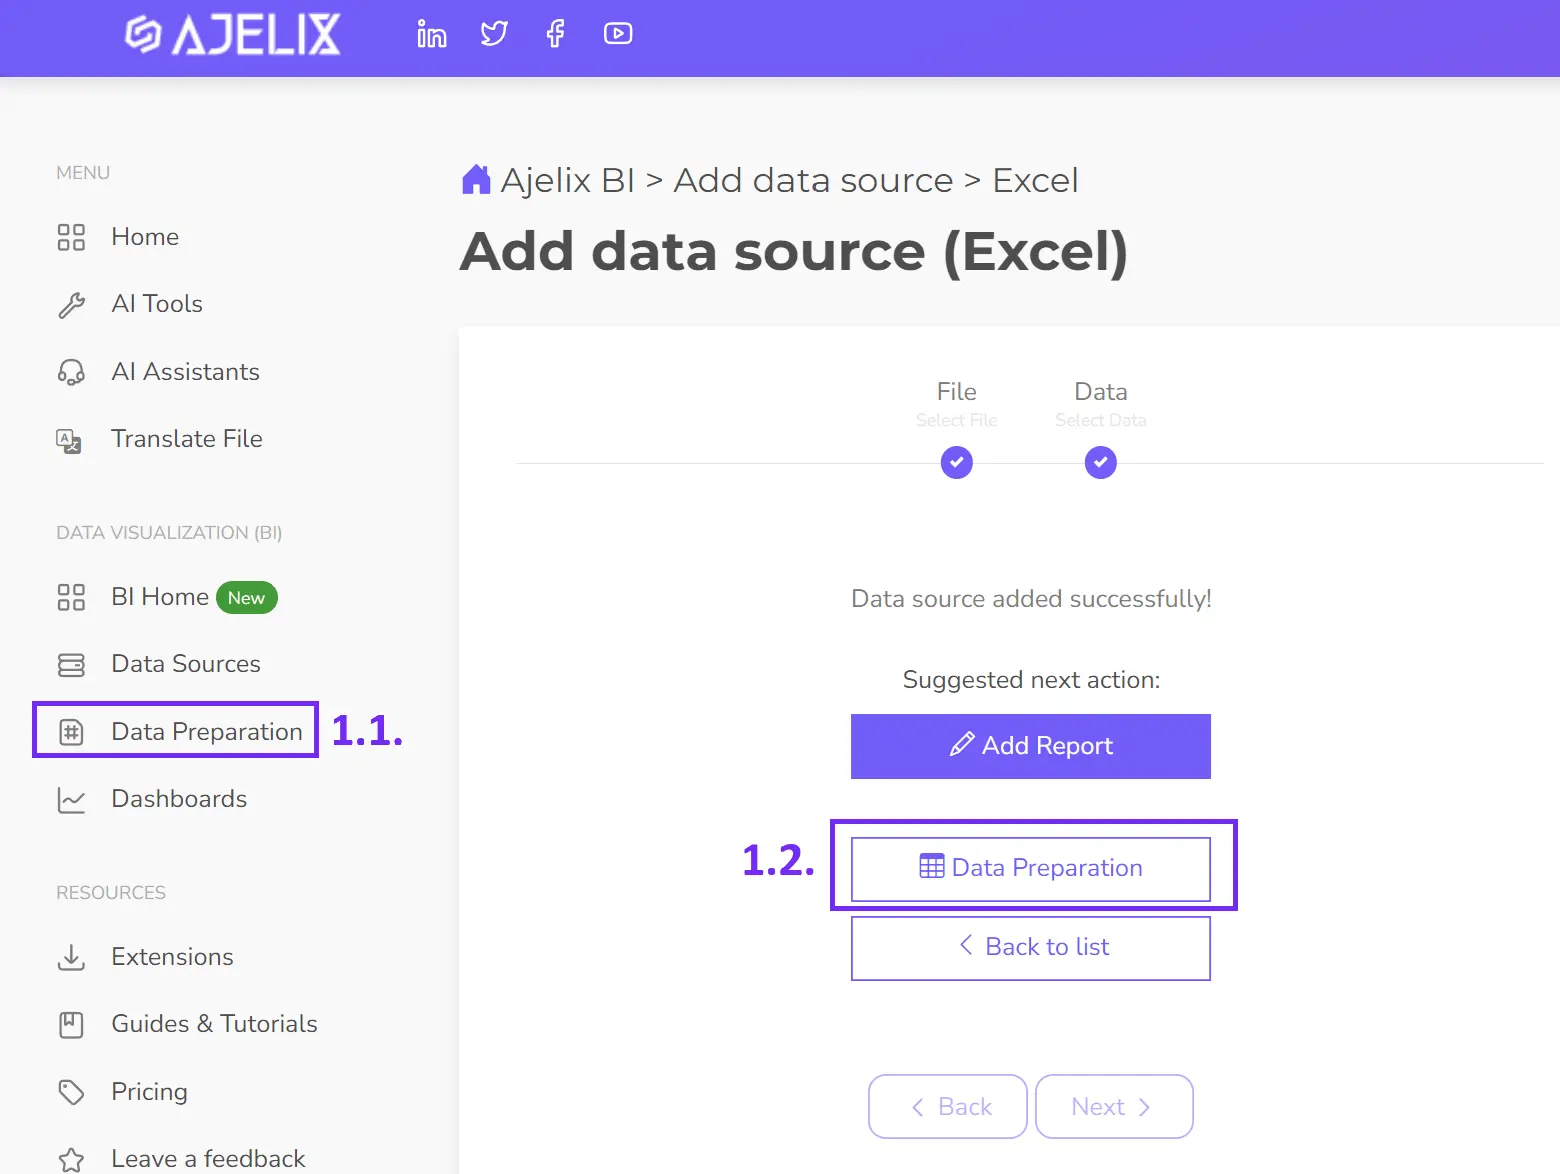
- Create KPIs
Calculating real estate KPIs can be complex, but it doesn’t have to be. Ajelix BI streamlines the process for many essential metrics. This article explores over 50 real estate KPIs that can be calculated directly within the platform. Creating custom KPIs is easy:
1. Connect your data source.
2. Build a new measure.
3. Name your KPI clearly.
4. Input the calculation formula.
5. Save your new KPI.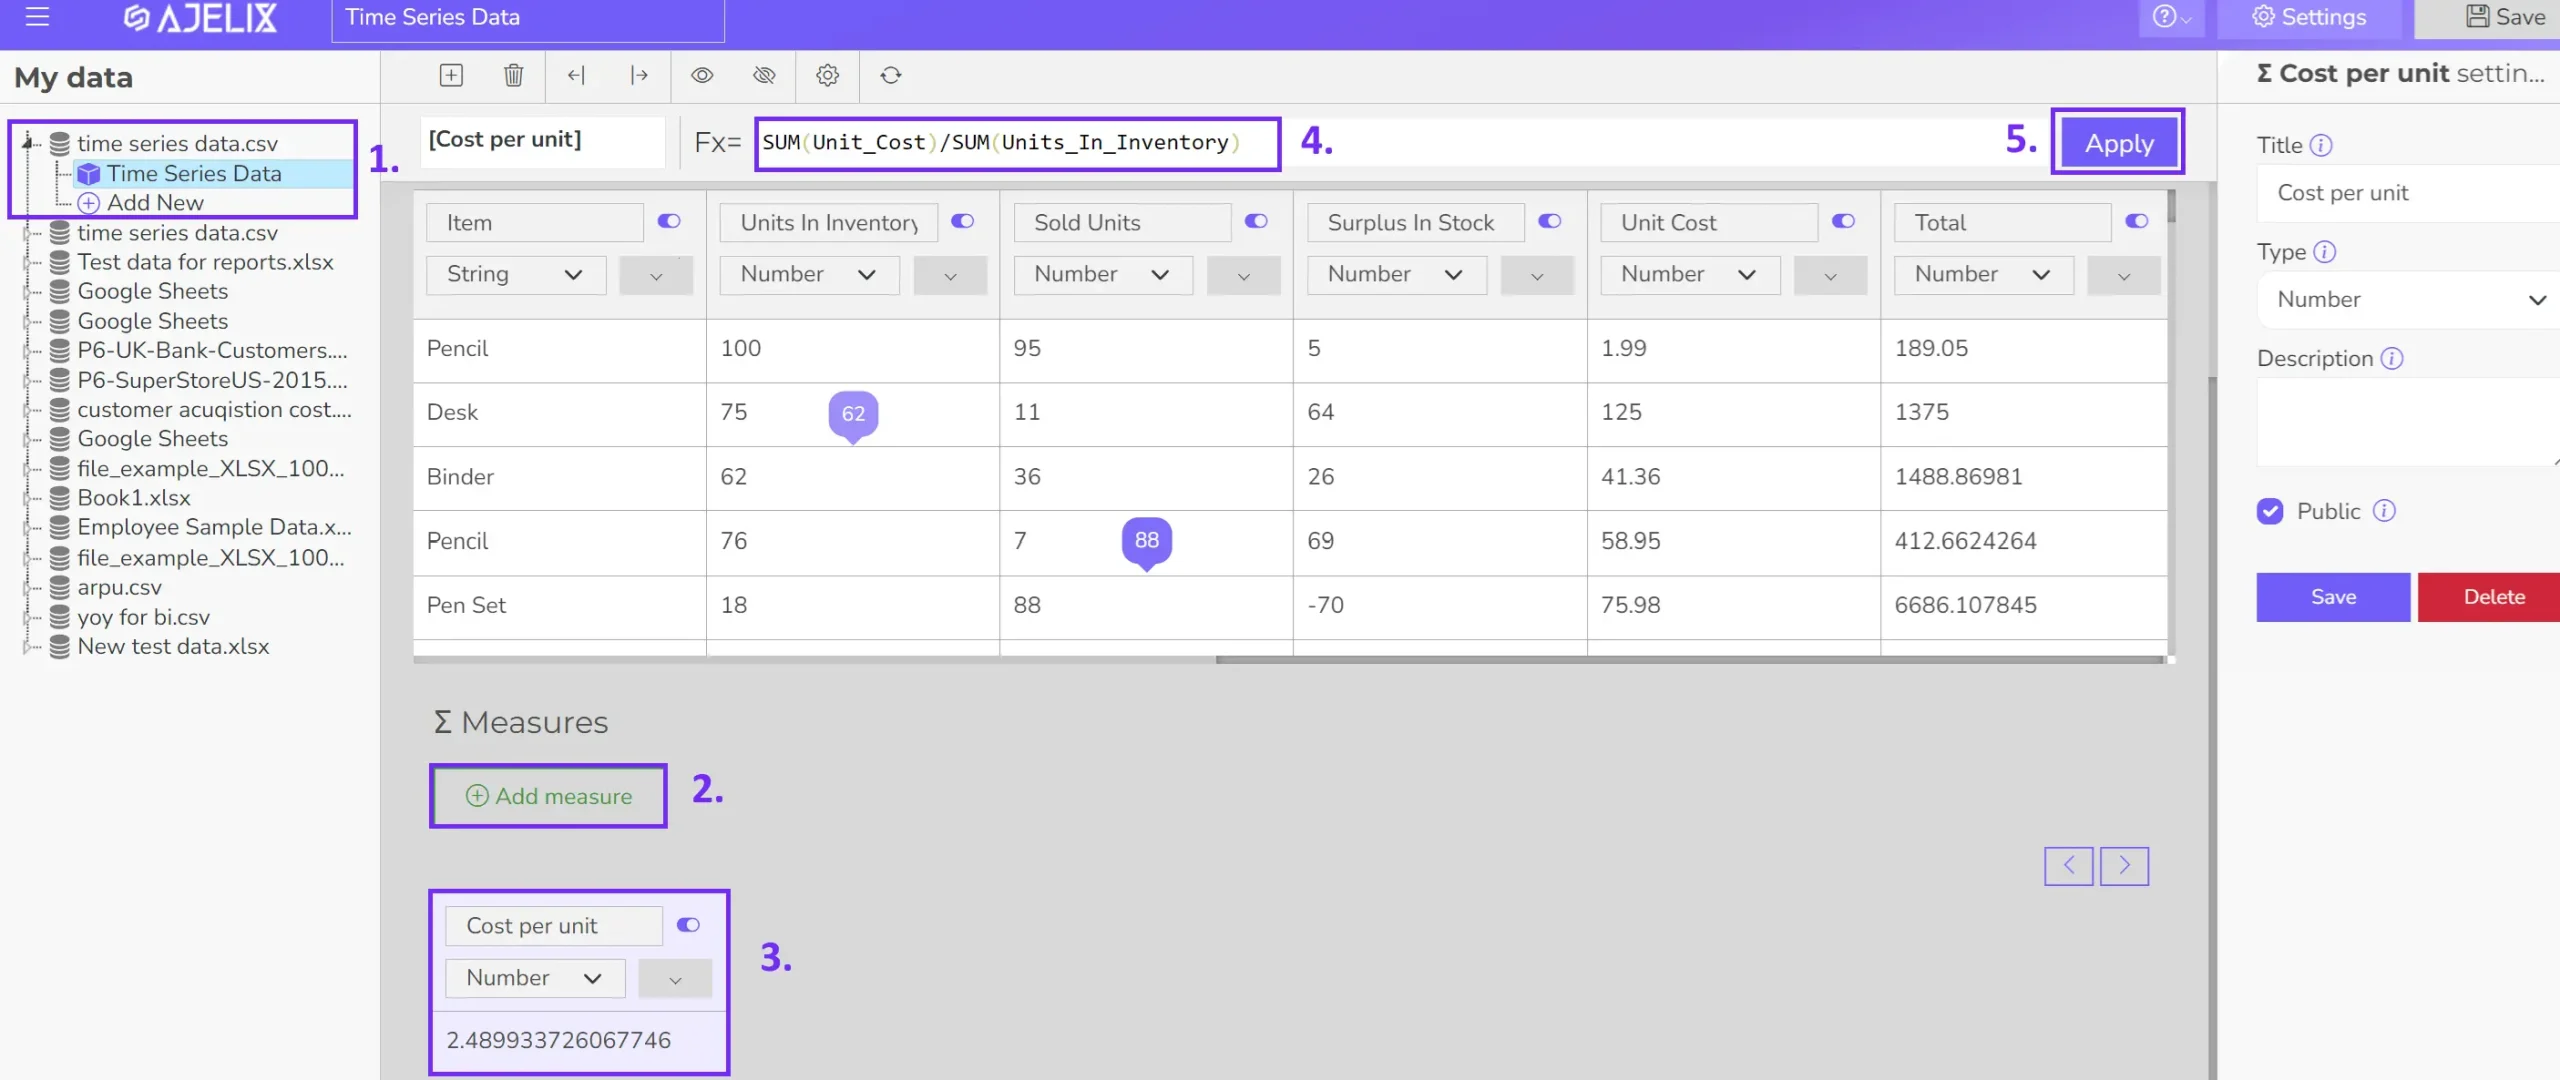
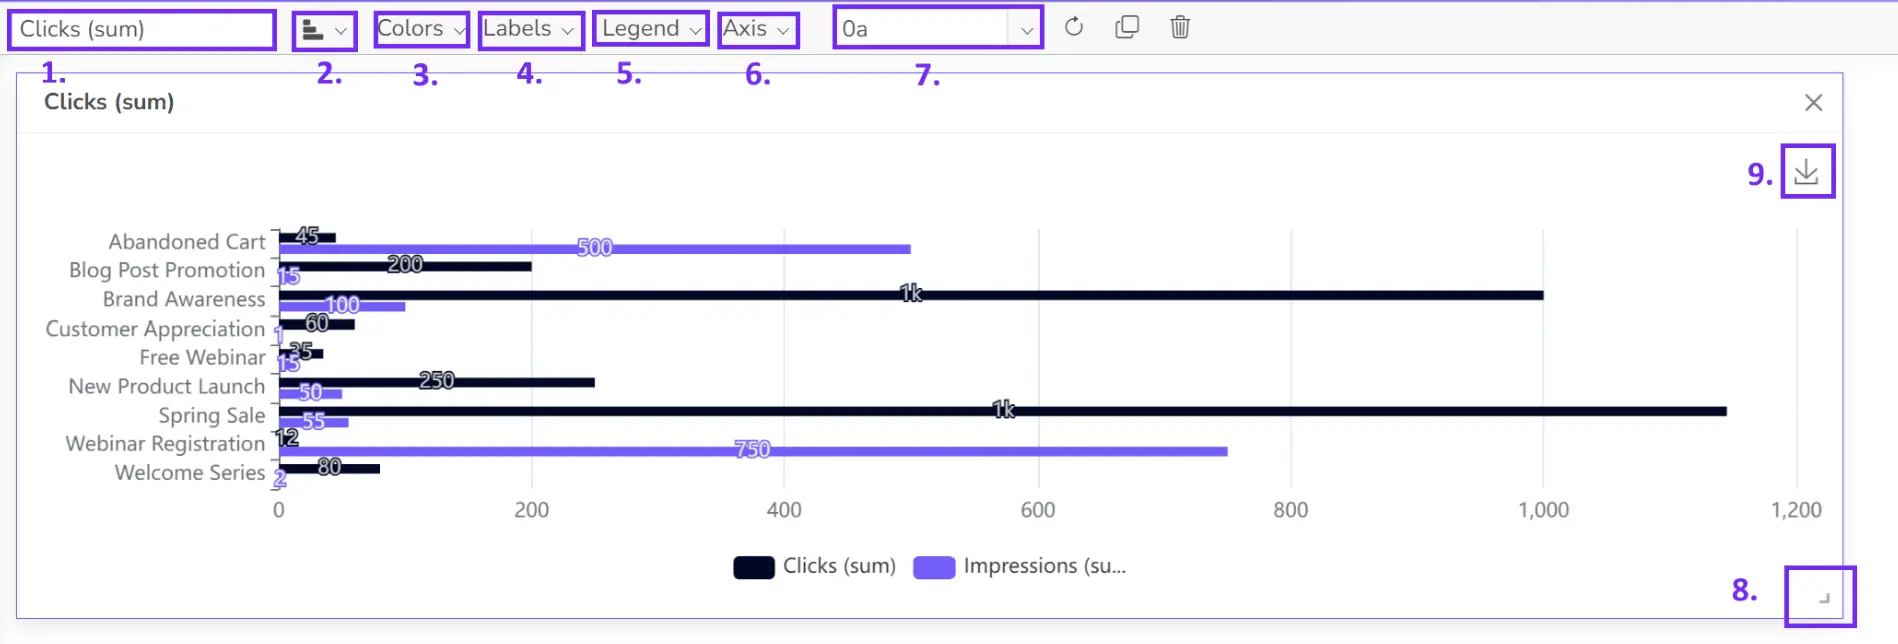
- Build your visualizations
Visualize your real estate KPIs with impactful charts and graphs. Choose from a range of options including cards, gauges, and line graphs. Simply drag and drop your data to create stunning visualizations. Alternatively, let Ajelix BI’s AI create a dashboard for you.
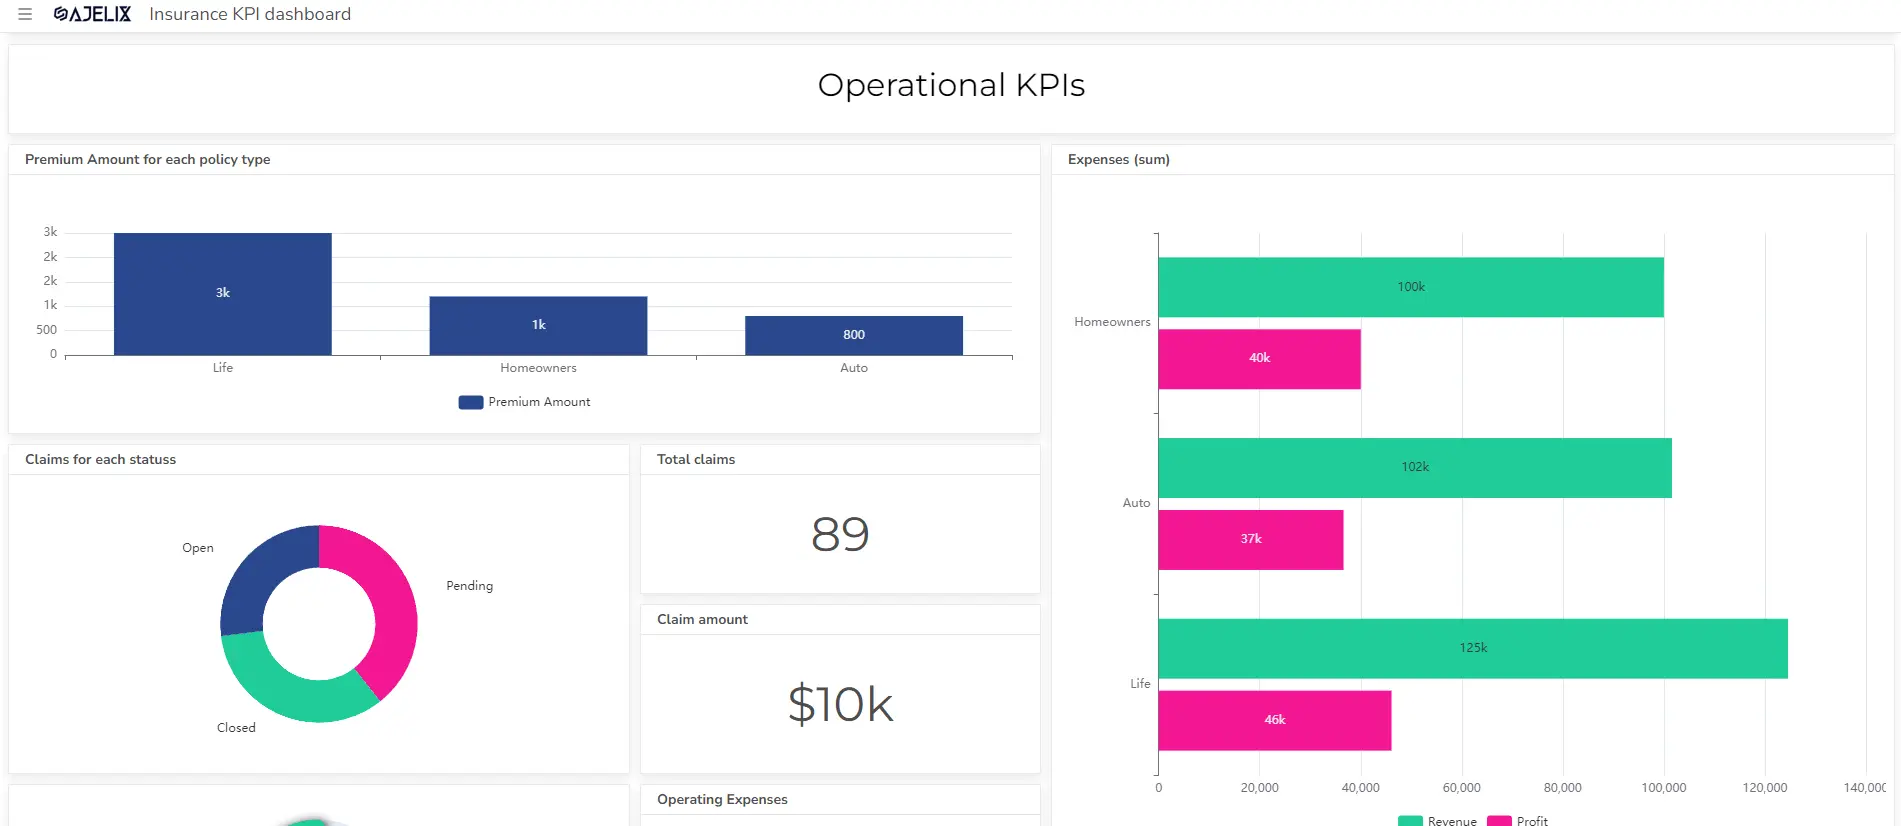
- Customize your dashboard
Make it yours. Customize your charts to perfection with clear titles, your brand’s signature colors, and a range of formatting options.
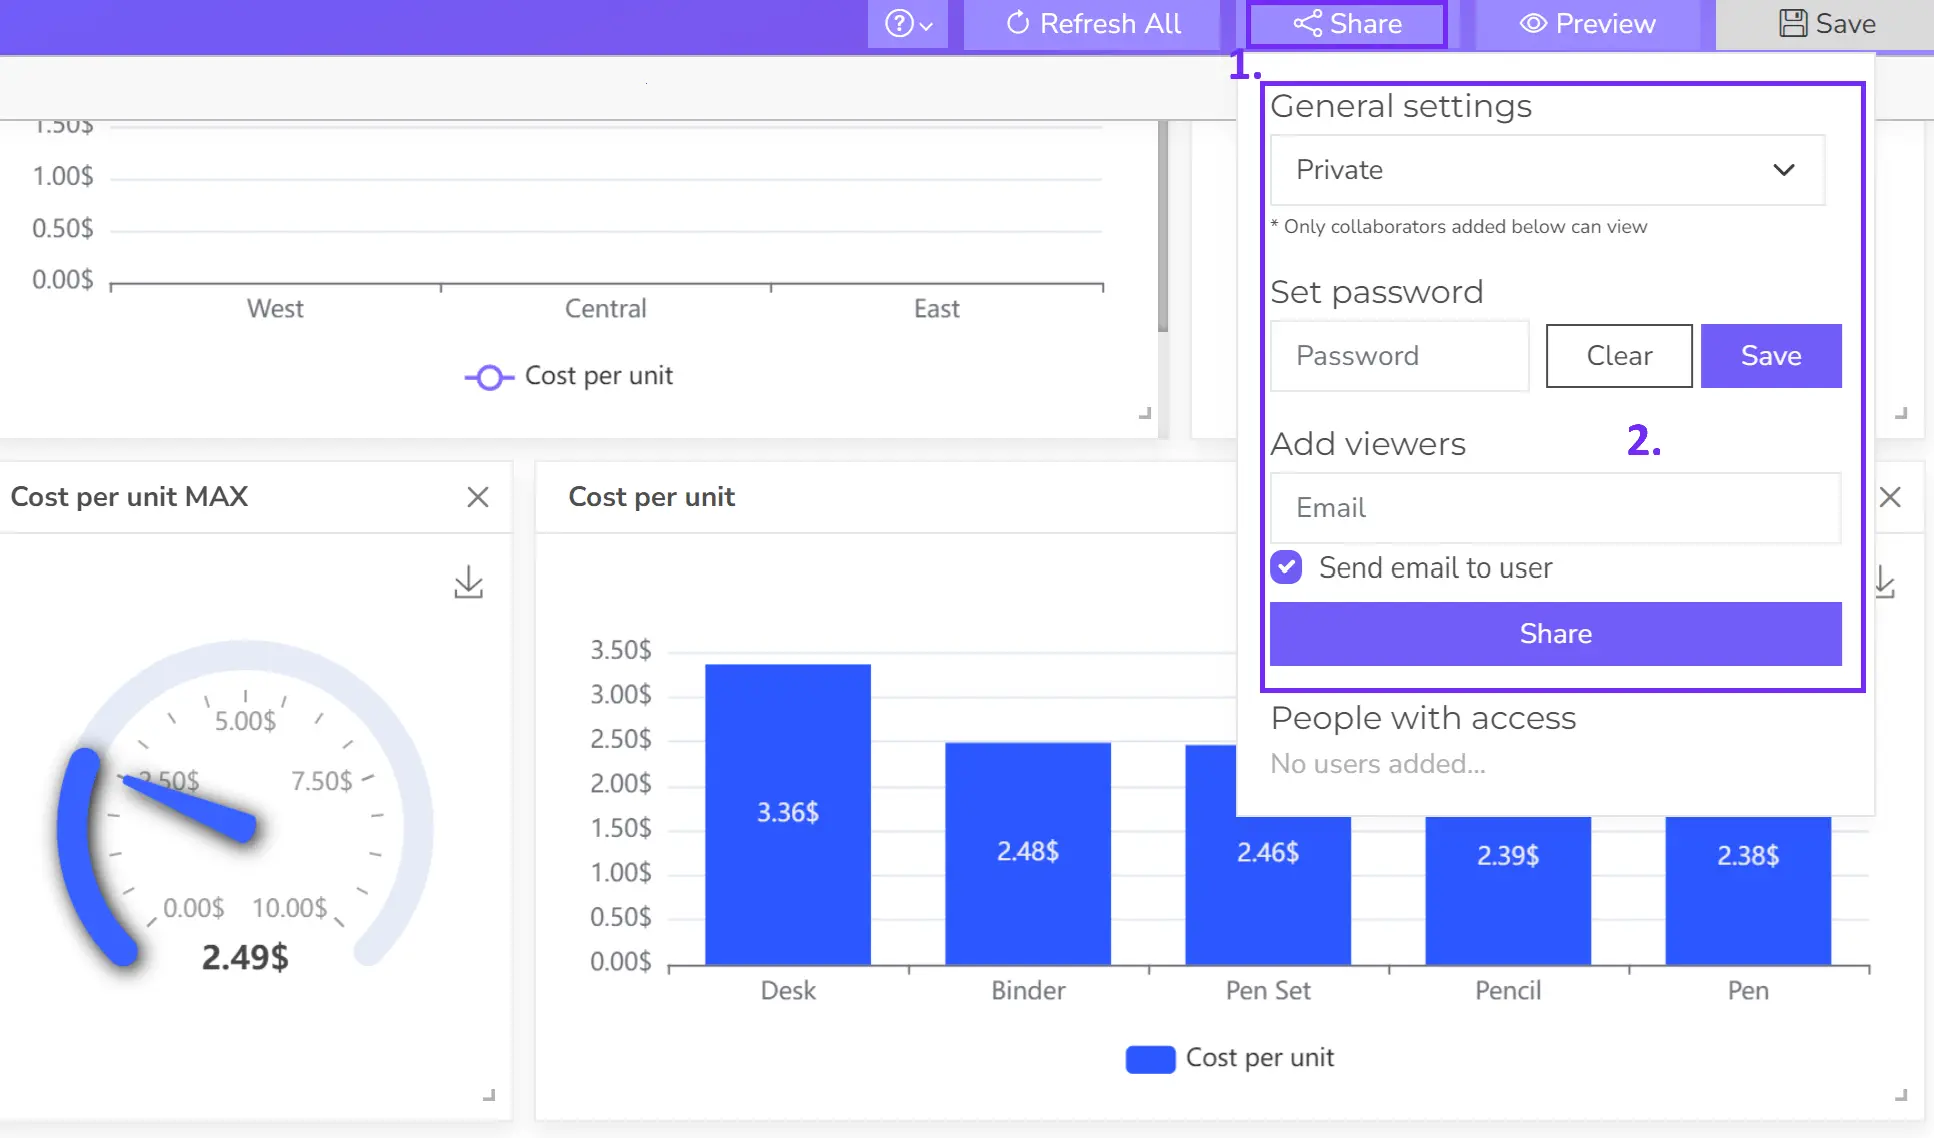
- Share your dashboard
Once happy, publish your dashboard and share it with relevant users for real-time insights.
Bonus: 55 Real Estate KPIs & Metrics By Role
KPIs can be categorized based on different aspects of the real estate business, considering your role in the real estate property. Different roles within the sector require specific metrics to track performance and inform strategic decisions.
The following table outlines key KPIs for real estate agents, investors, and property managers. We have also covered a guide on how to visualize real estate data.
| Role | KPIs | Description |
|---|---|---|
| Real Estate Agent | Listing to Sale Ratio | Measures efficiency in converting listings into sales |
| Average Days on Market (DOM) | Indicates how quickly properties sell | |
| Price-to-List Ratio | Compares final sale price to original listing price | |
| Average Commission Per Sale | Tracks earnings per closed deal | |
| Sales Volume | Total dollar value of properties sold | |
| Lead Conversion Rate | Measures effectiveness of turning leads into clients | |
| Leads Generated Per Month | Tracks number of potential clients identified | |
| Cost Per Lead (CPL) | Calculates expense of acquiring a new lead | |
| Appointment to Listing Conversion Rate | Measures how many appointments result in listings | |
| Net Promoter Score (NPS) | Indicates customer loyalty and satisfaction | |
| Client Reviews and Testimonials | Reflects customer feedback and experience | |
| Repeat Business Percentage | Measures percentage of clients who return | |
| Market Share | Determines percentage of the local market | |
| Time Spent on Client Activities | Evaluates time allocation | |
| Marketing ROI | Measures return on investment for marketing efforts | |
| Real Estate Investor | Return on Investment (ROI) | Measures profitability of an investment |
| Occupancy Rate | Indicates percentage of rented units | |
| Net Operating Income (NOI) | Calculates property’s profitability after operating expenses | |
| Capitalization Rate (Cap Rate) | Measures property’s potential return on investment | |
| Cash-on-Cash Return | Calculates cash return on initial cash investment | |
| Debt Service Coverage Ratio (DSCR) | Evaluates property’s ability to cover mortgage payments | |
| Rental Yield | Measures annual rental income as a percentage of property value | |
| Property Value Appreciation | Tracks increase in property value over time | |
| Days on Market (DOM) | Indicates how quickly rental units are filled | |
| Tenant Turnover Rate | Measures frequency of tenant changes | |
| Maintenance Expense Ratio | Calculates maintenance costs as a percentage of gross income | |
| Property Tax Rate | Measures property tax burden | |
| Operating Expense Ratio | Calculates operating expenses as a percentage of gross income | |
| Rental Growth Rate | Tracks increase in rental income over time | |
| Leverage Ratio | Measures proportion of debt used to finance a property | |
| Property Manager | Net Operating Income (NOI) | Measures property profitability after operating expenses |
| Occupancy Rate | Indicates percentage of rented units | |
| Average Rent Per Square Foot | Indicates rental income efficiency | |
| Rent Collection Efficiency | Percentage of rent collected on time | |
| Operating Expense Ratio | Operating expenses as a percentage of gross income | |
| Maintenance Cost Per Unit | Measures efficiency of property upkeep | |
| Turnover Rate | Percentage of units vacated and re-rented within a period | |
| Average Days to Lease | Time taken to fill a vacant unit | |
| Maintenance Request Turnaround Time | Measures responsiveness to tenant issues | |
| Staff Productivity | Evaluates employee efficiency in handling tasks | |
| Tenant Satisfaction Score | Measures overall tenant happiness | |
| Resident Retention Rate | Percentage of tenants renewing leases | |
| Lease Renewal Rate | Percentage of leases renewed | |
| Tenant Complaint Resolution Time | Indicates how quickly issues are addressed | |
| Online Reviews | Tracks tenant feedback on various platforms | |
| Real Estate Developer | Return on Investment (ROI) | Measures profitability of a development project |
| Time to Market | Measures time from project inception to completion | |
| Development Cost Per Square Foot | Measures efficiency of development costs | |
| Sales Velocity | Measures speed of property sales | |
| Absorption Rate | Measures rate at which available units are sold | |
| Pre-sale Contract Value | Measures value of contracts signed before completion | |
| Construction Cost Overrun | Measures deviation from projected construction costs | |
| Average Selling Price | Measures average price of sold units | |
| Profit Margin | Measures overall profitability of the project | |
| Occupancy Rate (for rental projects) | Indicates percentage of rented units |
By understanding and utilizing these KPIs, real estate professionals can optimize their performance, identify areas for improvement, and make data-driven decisions to achieve greater success.
For better tracking consider using a BI tool, such as Ajelix to help you set up digital dashboards and track your KPIs regularly.
Tools For Real Estate KPI Tracking
- BI platforms & Data Visualization tools: Offer advanced data analysis and visualization capabilities, allowing for complex KPI calculations and reporting. Here are a few alternatives you can use: Ajelix BI, Tableau, Power BI, and Zoho Analytics.
- Microsoft Excel: A versatile tool for basic KPI calculations and tracking, especially for smaller operations
- Real estate CRMs: Many CRMs offer built-in KPI tracking and reporting features.
- Property management software: These platforms often include tools for monitoring property performance and financial metrics.
FAQ
KPIs are quantifiable measurements used to assess the performance of a real estate business, investment, or individual agent. They provide insights into various aspects of the industry, such as sales, marketing, property management, and investment returns.
The frequency of KPI tracking depends on the specific metric and your business goals. Some KPIs should be monitored daily, weekly, or monthly, while others might require quarterly or annual analysis.
A good average DOM varies by market and property type. Generally, a lower DOM indicates faster sales and is considered more desirable.
Several tools can be used for tracking real estate KPIs, including CRMs, property management software, BI platforms, and spreadsheet software like Excel.
A real estate KPI dashboard can be created using BI tools or spreadsheet software. Start by selecting the most important KPIs, gathering data, and designing visualizations.
Yes, there are free tools available, such as Ajelix BI, Google Sheets, and Google Data Studio, that can be used for basic KPI tracking. However, for more complex needs, paid tools may be necessary.
From data to report in one minute or less with Ajelix BI