10 Administrative KPIs For Admin Department Performance

Administrative KPIs are key performance indicators that measure the efficiency and effectiveness of admin functions within an organization. They are used to assess the performance of the admin department, processes, and systems to identify areas for improvement.
The administrative backbone of any organization often operates in the shadows, handling the critical details that keep businesses running smoothly. Measure performance to ensure this vital function is optimized. 📈
This article highlights 10 key performance indicators (KPIs) that can help you gauge the efficiency and effectiveness of your administrative department.
Change the way you work with agentic AI
One-click dashboards,KPI tracking, and AI-powered insights—for work that actually gets done.

What are administrative KPIs?
Administrative KPIs are specific performance metrics used to evaluate the efficiency and effectiveness of an administrative department.
These measurements provide insights into how well administrative tasks are handled, how resources are utilized, and how the department contributes to organizational goals and the administrative manager. These KPIs can be included in management reporting.
Implementing KPI tracking for your administrative department is a strategic move to enhance efficiency, productivity, and overall performance. Here are the steps you should take:
- Identify Key Performance Indicators (KPIs): ensure KPIs directly contribute to broader business objectives.
- Data Collection and Measurement: determine where to collect data and implement consistent data collection processes.
- Set Clear Targets and Benchmarks: set achievable yet challenging targets for each KPI.
- Choose the Right Tools: Consider tools that streamline data collection, analysis, and reporting, such as BI tools.
- Regular Monitoring and Analysis: Monitor KPIs regularly (e.g., weekly, monthly, quarterly).
- Provide Feedback and Recognition: Provide regular performance feedback based on KPI data.To reinforce KPI achievements and sustain motivation, consider customizable award recognition such as service awards, top-performer trophies, or on-the-spot plaques tailored by department and occasion. Tangible rewards help boost engagement metrics like employee satisfaction with administrative support.
- Continuous Improvement: Continuously challenge the team to improve performance.
Did you know you can automate the KPI calculation process and get live updates for your data? Set up your administrative KPI dashboard on Ajelix BI.
The 10 Most Important Administrative KPIs
- Average task completion time
- Error rate
- Resource utilization
- Travel and Expense Report Processing Time
- Average response time to inquiries
- Customer satisfaction rating KPI
- Cycle time for administrative processes
- Cost per transaction
- Document Turnaround Time
- Employee satisfaction with administrative support
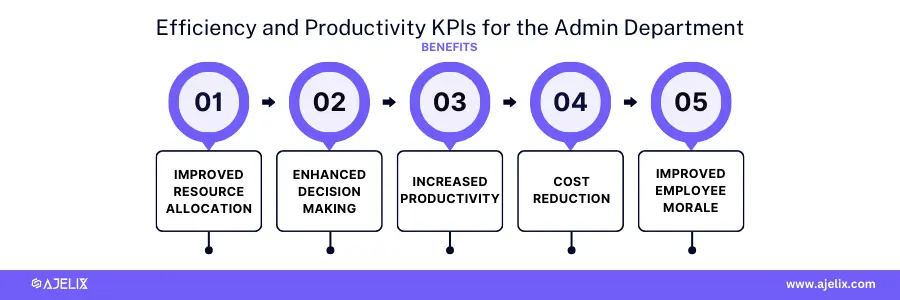
Efficiency and Productivity KPIs for the Admin Department
Efficiency and productivity key performance indicators are crucial for measuring the performance of an administrative department. They provide insights into how effectively resources are utilized, tasks are completed, and overall output is generated. You might also like an article about 20 KPIs for small business owners to track.
Benefits of Tracking Efficiency and Productivity KPIs:
- Improved resource allocation: Identifies areas where resources are underutilized or overutilized.
- Enhanced decision-making: Provides data-driven insights for strategic planning.
- Increased productivity: Helps identify bottlenecks and areas for process improvement.
- Cost reduction: Optimizes resource usage and reduces operational expenses.
- Improved employee morale: Recognizes and rewards high performance.
1. Average task completion time
Measures the efficiency and productivity of the administrative team by determining the average time taken to complete a task.
Formula
Average Task Completion Time = Total Time Spent on Tasks / Number of Tasks Completed
Example
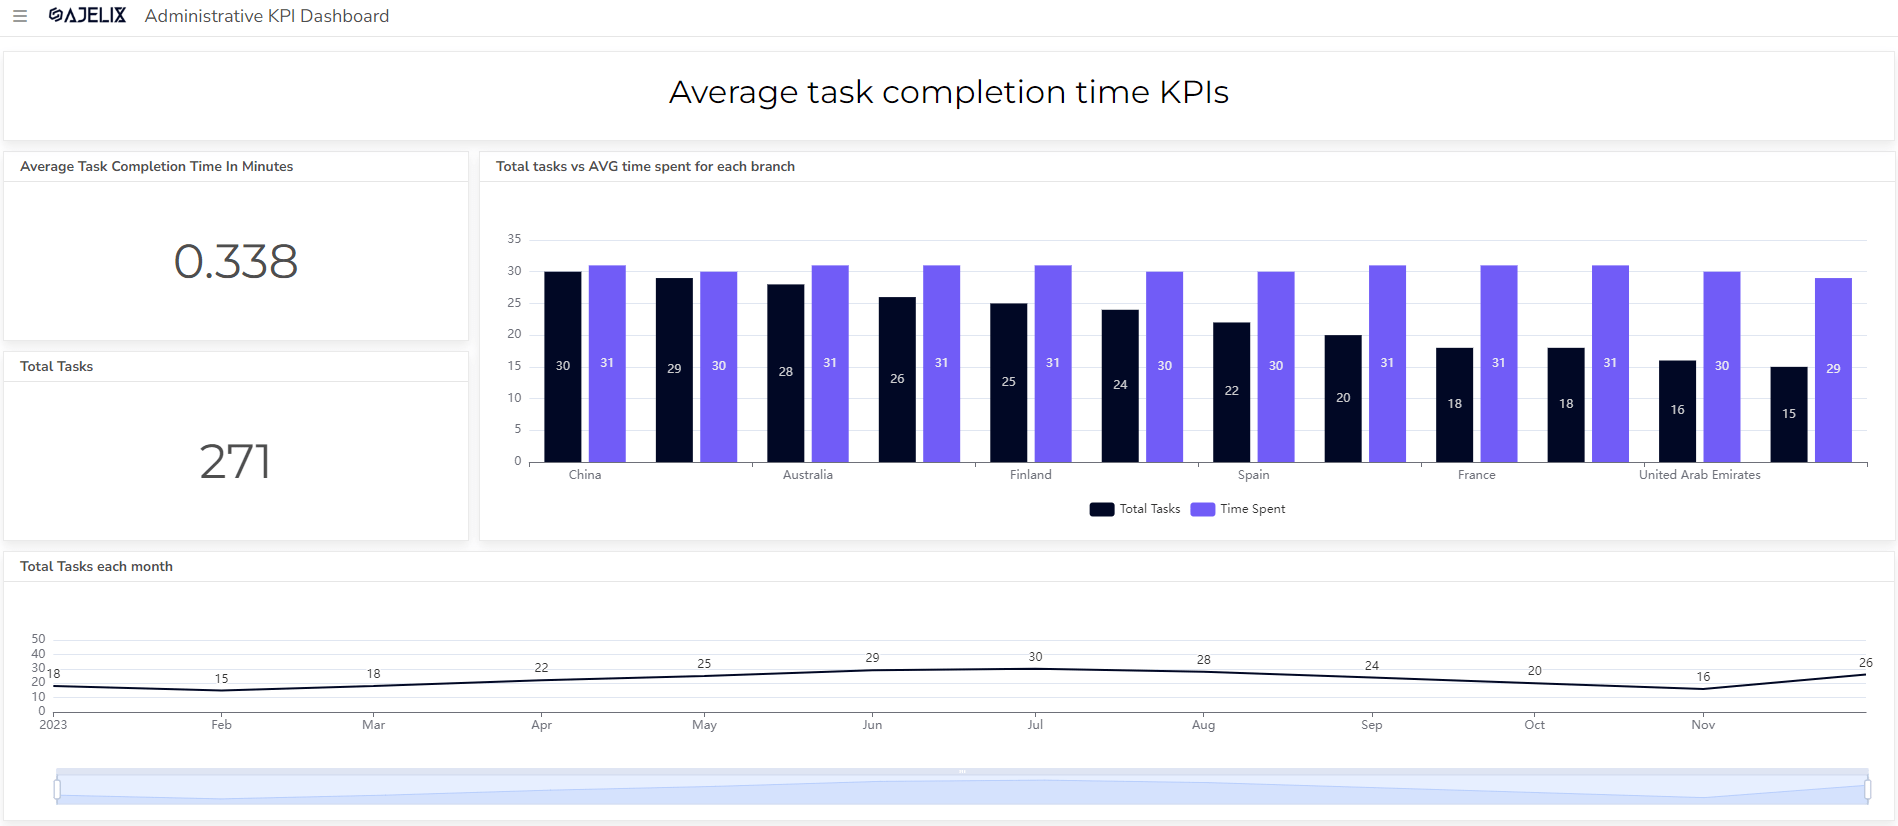
If it takes 200 minutes to complete 10 tasks, the average task completion time is 20 minutes (200 minutes / 10 tasks).
Good Score
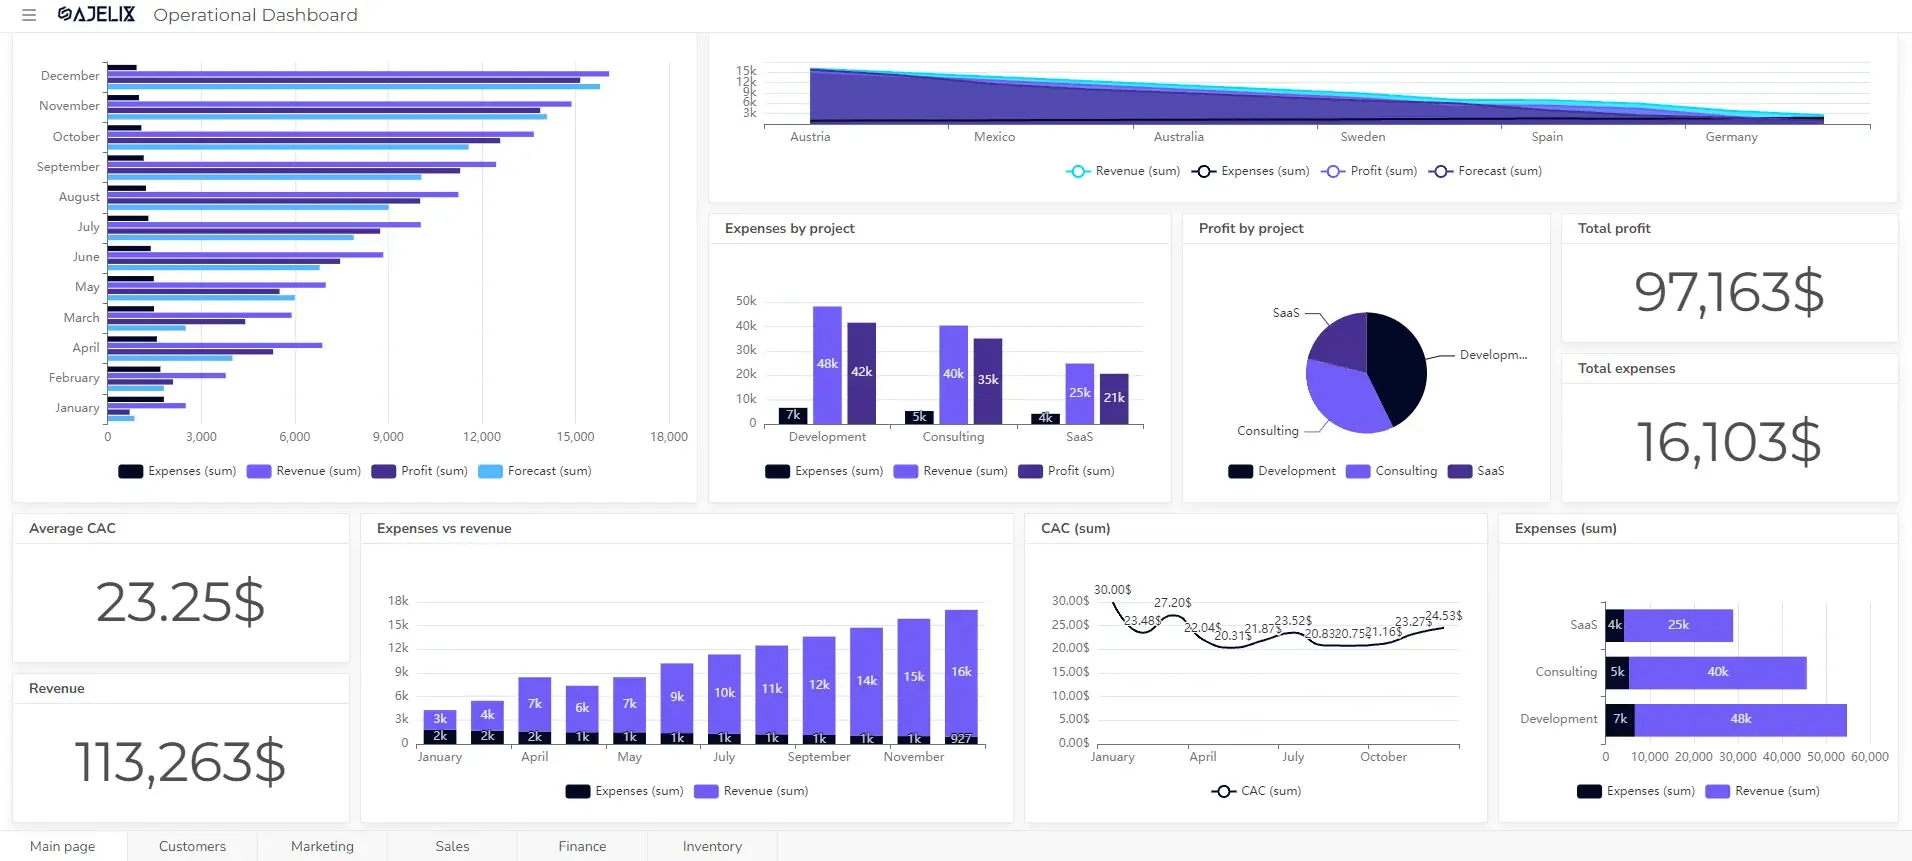
A good score depends on the specific task and industry standards. However, generally, a decreasing trend in average task completion time over time indicates improved efficiency. These KPIs can be visualized using the operational dashboard.
2. Error rate
Error rate measures the accuracy and quality of work the administrative team performs.
Formula
Error Rate = (Number of Errors / Total Number of Tasks) * 100
Example
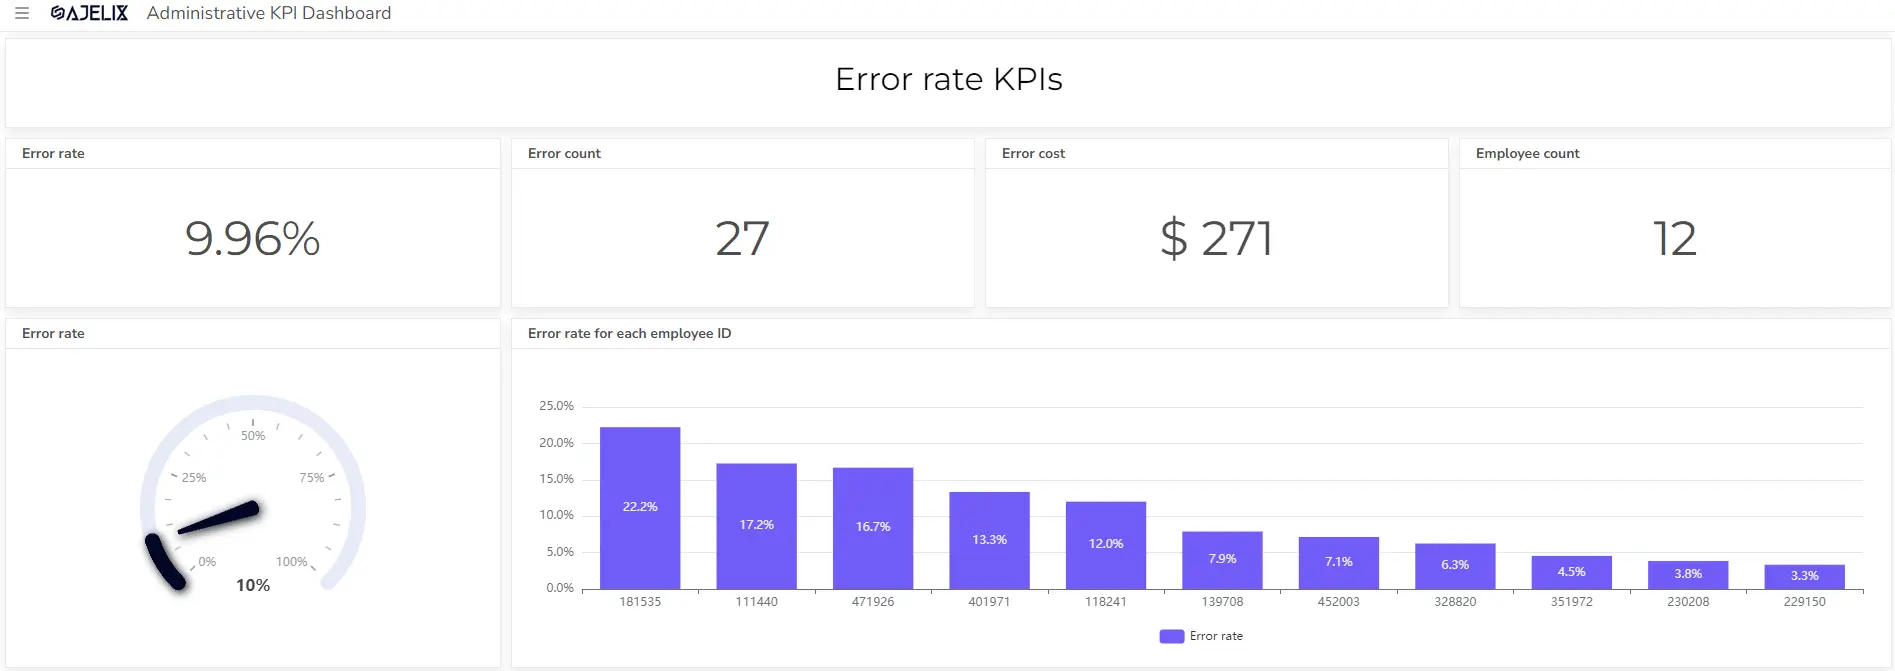
If there are 5 errors in 100 tasks, the error rate is 5% (5 / 100 * 100).
Good Score
A lower error rate is generally better. The acceptable error rate depends on the specific task and industry standards. For example, a very low error rate (e.g., less than 1%) is crucial in financial tasks. However, for less critical tasks, a slightly higher error rate might be acceptable. You might also find this article useful 20 financial KPIs for finance department.
3. Resource utilization
Resource utilization measures how efficiently resources (e.g., equipment, personnel) are being used.
Formula
Resource Utilization = (Total Resource Hours Used / Total Available Resource Hours) * 100
Example
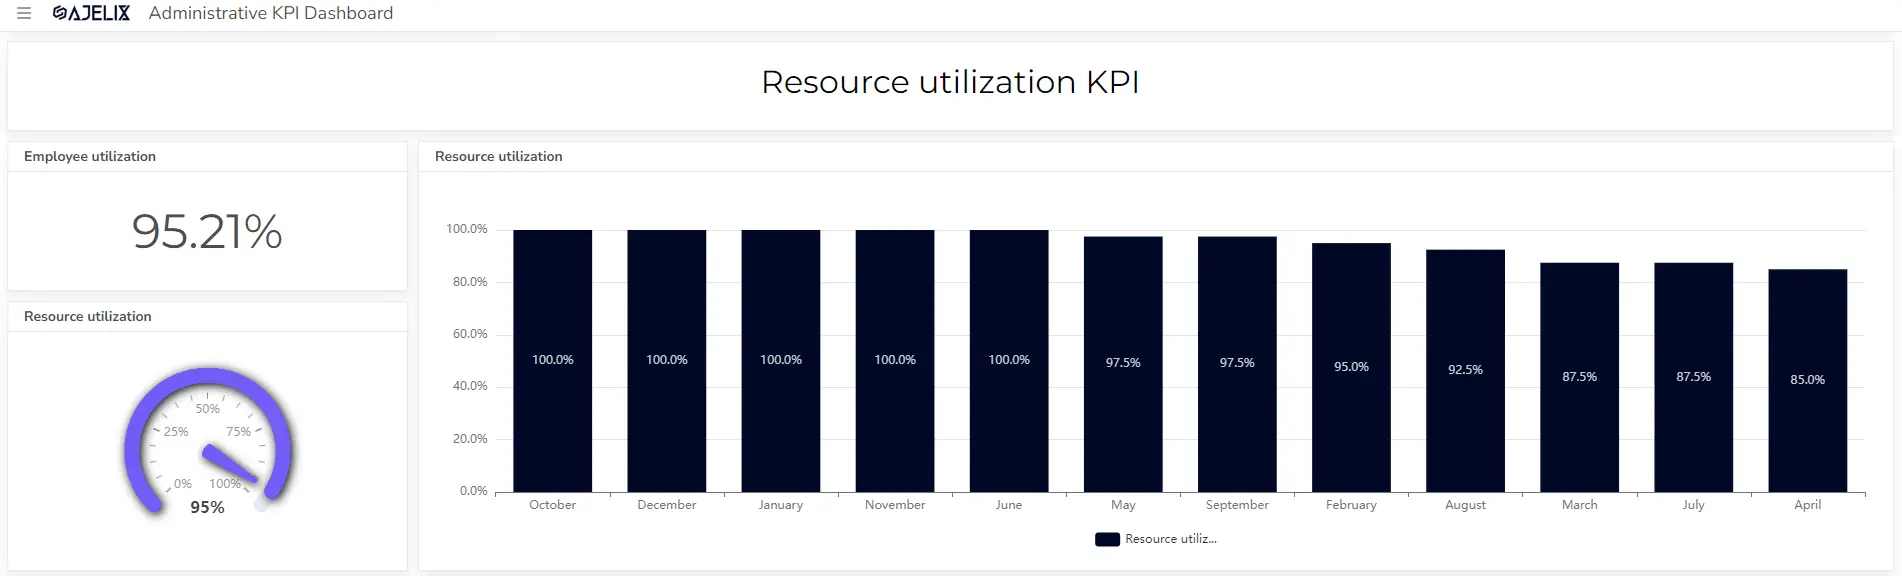
If a team member has 40 available hours in a week and works on tasks for 32 hours, the resource utilization is 80% (32 hours / 40 hours * 100).
Good Score
A high resource utilization rate indicates efficient use of resources. However, an excessively high rate might indicate overwork or inefficiency. The optimal range depends on the specific resource and industry standards. Generally, a utilization rate between 70% and 85% is considered good.
4. Travel and Expense Report Processing Time
Measures the efficiency of processing travel and expense reports.
Formula
Travel and Expense Report Processing Time = Total Processing Time for Expense Reports / Number of Expense Reports Processed
Example
If it takes 50 hours to process 25 expense reports, the processing time is 2 hours per report.
Good score
A lower processing time indicates higher efficiency. The acceptable time depends on the complexity of expense reports and company size. Generally, a shorter processing time is better.
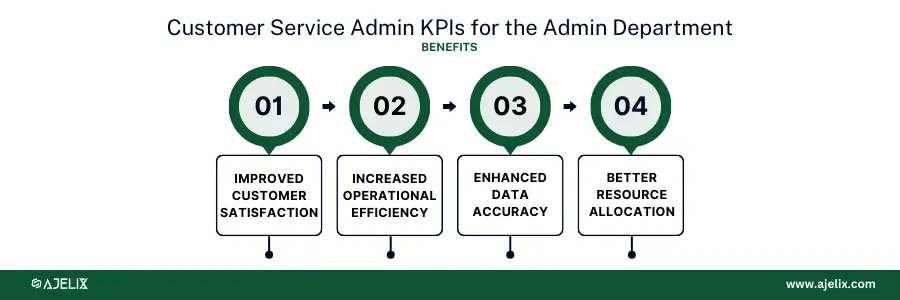
Customer Service Admin KPIs
Customer Service Admin KPIs measure the performance of the administrative function in supporting customer service operations. While the admin team doesn’t directly interact with customers, their role is crucial in ensuring smooth customer service delivery.
Benefits of Tracking Customer Service Admin KPIs:
- Improved customer satisfaction: By supporting customer-facing teams efficiently, admin teams indirectly contribute to customer satisfaction.
- Increased operational efficiency: Identifying bottlenecks and inefficiencies in administrative tasks can streamline processes and reduce costs.
- Enhanced data accuracy: Ensuring accurate data management is essential for effective customer service.
- Better resource allocation: Analyzing KPI data can help optimize staffing and resource allocation.
5. Average response time to inquiries
Average response time to inquiries measures the responsiveness of the administrative team to customer or internal inquiries.
Formula
Average Response Time = Total Response Time / Number of Inquiries
Example
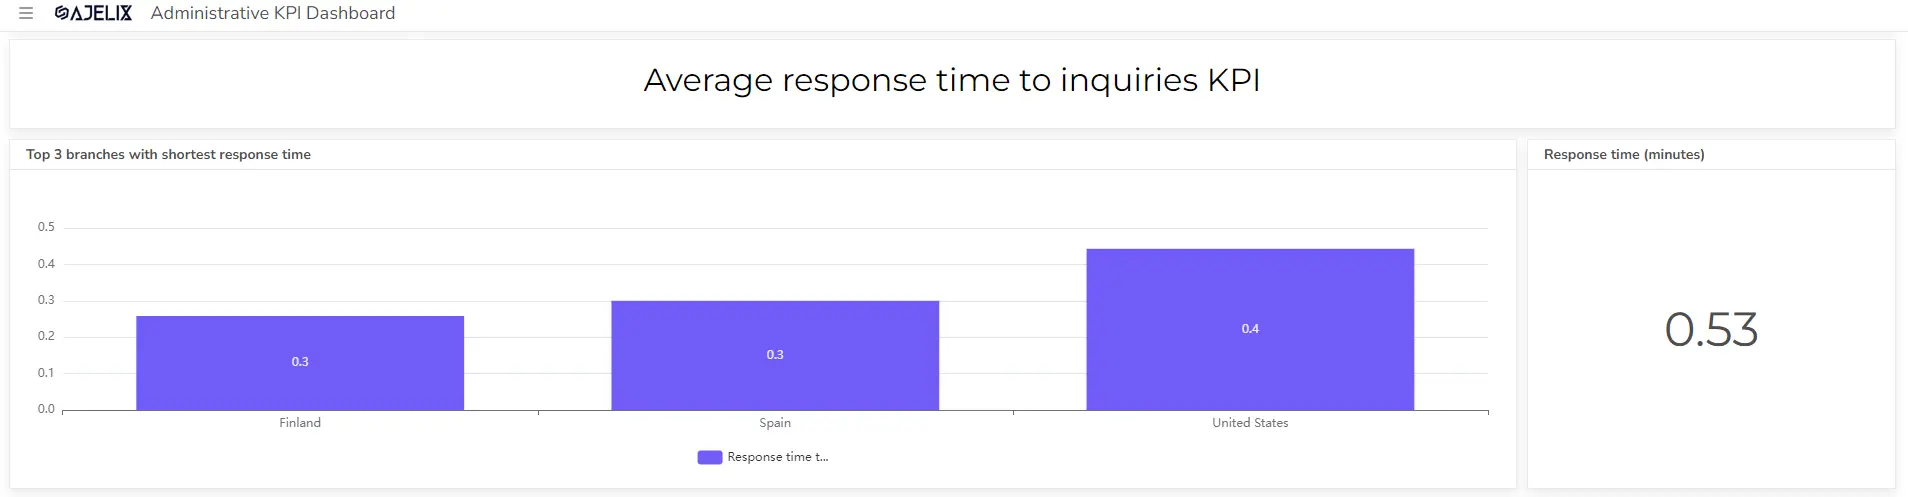
If it takes 100 minutes to respond to 5 inquiries, the average response time is 20 minutes (100 minutes / 5 inquiries).
Good Score
A lower average response time indicates better responsiveness. The acceptable response time depends on the nature of the inquiries and industry standards. For example, in customer service, a shorter response time is crucial.
6. Customer satisfaction rating KPI
Customer satisfaction rating measures the overall satisfaction level of customers with the administrative services provided.
Formula
Customer Satisfaction Rating = (Number of Satisfied Customers / Total Number of Customers) * 100
Example
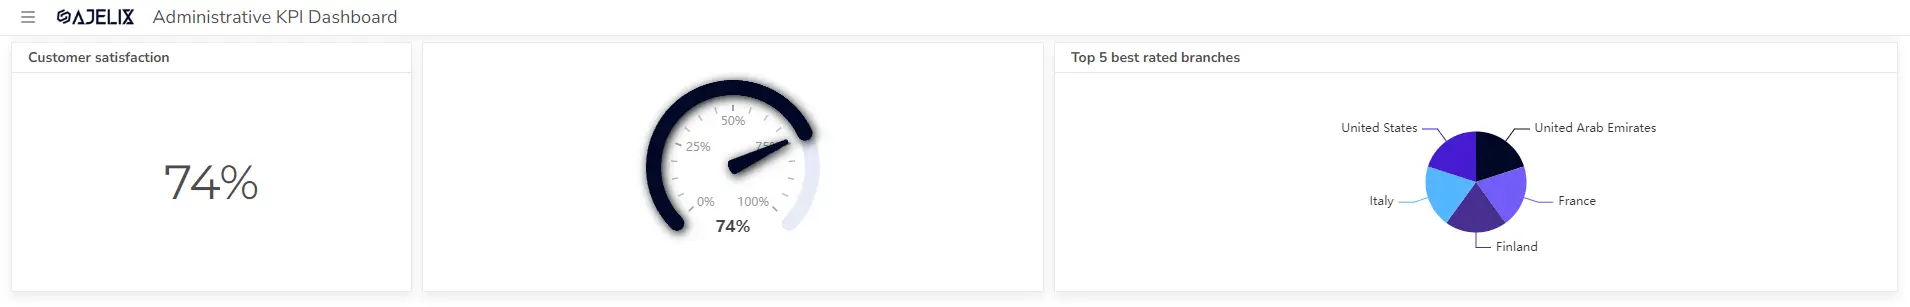
If 80 out of 100 customers are satisfied, the customer satisfaction rating is 80% (80 / 100 * 100).
Good Score
A higher customer satisfaction rating indicates better service quality. The acceptable rating varies by industry and company standards. Generally, a rating above 80% is considered good.
However, it’s important to consider other factors like customer feedback and net promoter score (NPS) for a more comprehensive understanding of customer satisfaction.
Administrative KPIs For Process Improvement
The primary goal of tracking process improvement KPIs is to continuously enhance the efficiency and effectiveness of administrative processes, leading to overall organizational improvement.
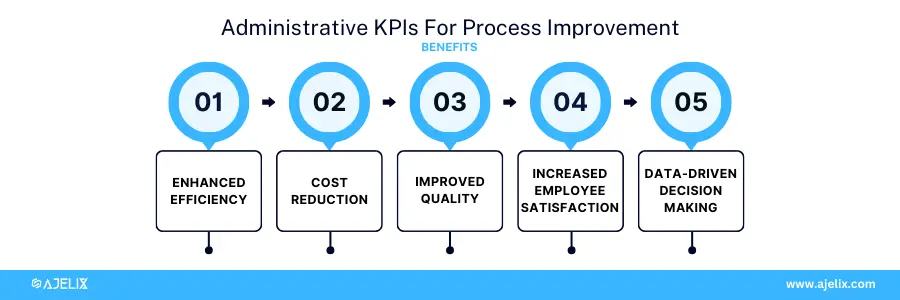
Benefits of Tracking Process Improvement KPIs
- Enhanced efficiency: By identifying slow processes, organizations can streamline operations and reduce waste.
- Cost reduction: Optimized processes often lead to lower operational costs.
- Improved quality: Streamlined processes can reduce errors and improve output quality.
- Increased employee satisfaction: Efficient processes can reduce employee frustration and burnout.
- Data-driven decision making: KPIs provide the necessary data to make informed decisions about process changes.
7. Cycle time for administrative processes
Measures the duration of an administrative process from start to finish.
Formula
Cycle Time = Total Process Completion Time / Number of Processes Completed
Example
If it takes 200 hours to complete 5 invoice processing cycles, the cycle time is 40 hours per cycle (200 hours / 5 cycles).
Good Score
A shorter cycle time indicates a more efficient process. The ideal cycle time depends on the specific process and industry standards.
For instance, if the industry standard for processing an invoice is 24 hours, a cycle time of 36 hours would be considered room for improvement.
8. Cost per transaction
Measures the efficiency of administrative processes in terms of cost.
Formula
Cost Per Transaction = Total Administrative Costs / Total Number of Transactions
Example
If the total administrative costs for processing 1000 invoices is $5000, the cost per transaction is $5 (5000 / 1000).
Good Score
A lower cost per transaction indicates higher efficiency. The acceptable cost per transaction depends on industry standards, company budgets, and the complexity of the transaction.
The goal is to continuously reduce the cost per transaction while maintaining quality and service levels.
9. Document Turnaround Time
Measures the time taken to process and complete documents.
Formula
Document Turnaround Time = Total Document Processing Time / Number of Documents Processed
Example
If it takes 100 hours to process 50 documents, the turnaround time is 2 hours per document.
Good Score
A lower turnaround time indicates higher efficiency. The acceptable time depends on the document type, complexity, and industry standards.
Aim to reduce turnaround time gradually through process improvements and automation.
10. Employee satisfaction with administrative support
Measures employees’ satisfaction with the support provided by the administrative team.
Note: This KPI is typically measured through surveys or feedback mechanisms rather than a strict formula. However, we can use a simplified approach to illustrate the concept.
Simplified Calculation (for illustrative purposes only)
- Employee Satisfaction Score: Assign a numerical value to each response option (e.g., 1-5).
- Average Satisfaction Score: Calculate the average of all scores.
Example
- Conduct an employee satisfaction survey with a 5-point Likert scale (1 = Strongly Disagree, 5 = Strongly Agree).
- Calculate the average score of all responses to questions related to administrative support.
Good Score
A higher average satisfaction score indicates better employee satisfaction. While there’s no universal standard, a score above 4 (on a 5-point scale) generally indicates high satisfaction.
Important:
- This KPI is qualitative in nature and requires regular feedback collection.
- Analyzing specific feedback is crucial to identify areas for improvement.
- Consider using Net Promoter Score (NPS) for a more in-depth analysis of employee loyalty.
Remember, this is a simplified approach. Effective measurement of employee satisfaction requires comprehensive surveys, analysis of open-ended responses, and correlation with other HR metrics.
How To Create A KPI Dashboard For Admin Department?
Time needed: 5 hours
This guide will take you through the steps on how to create a KPI dashboard. Ajelix BI offers freemium so you can test this process to understand if this helps.
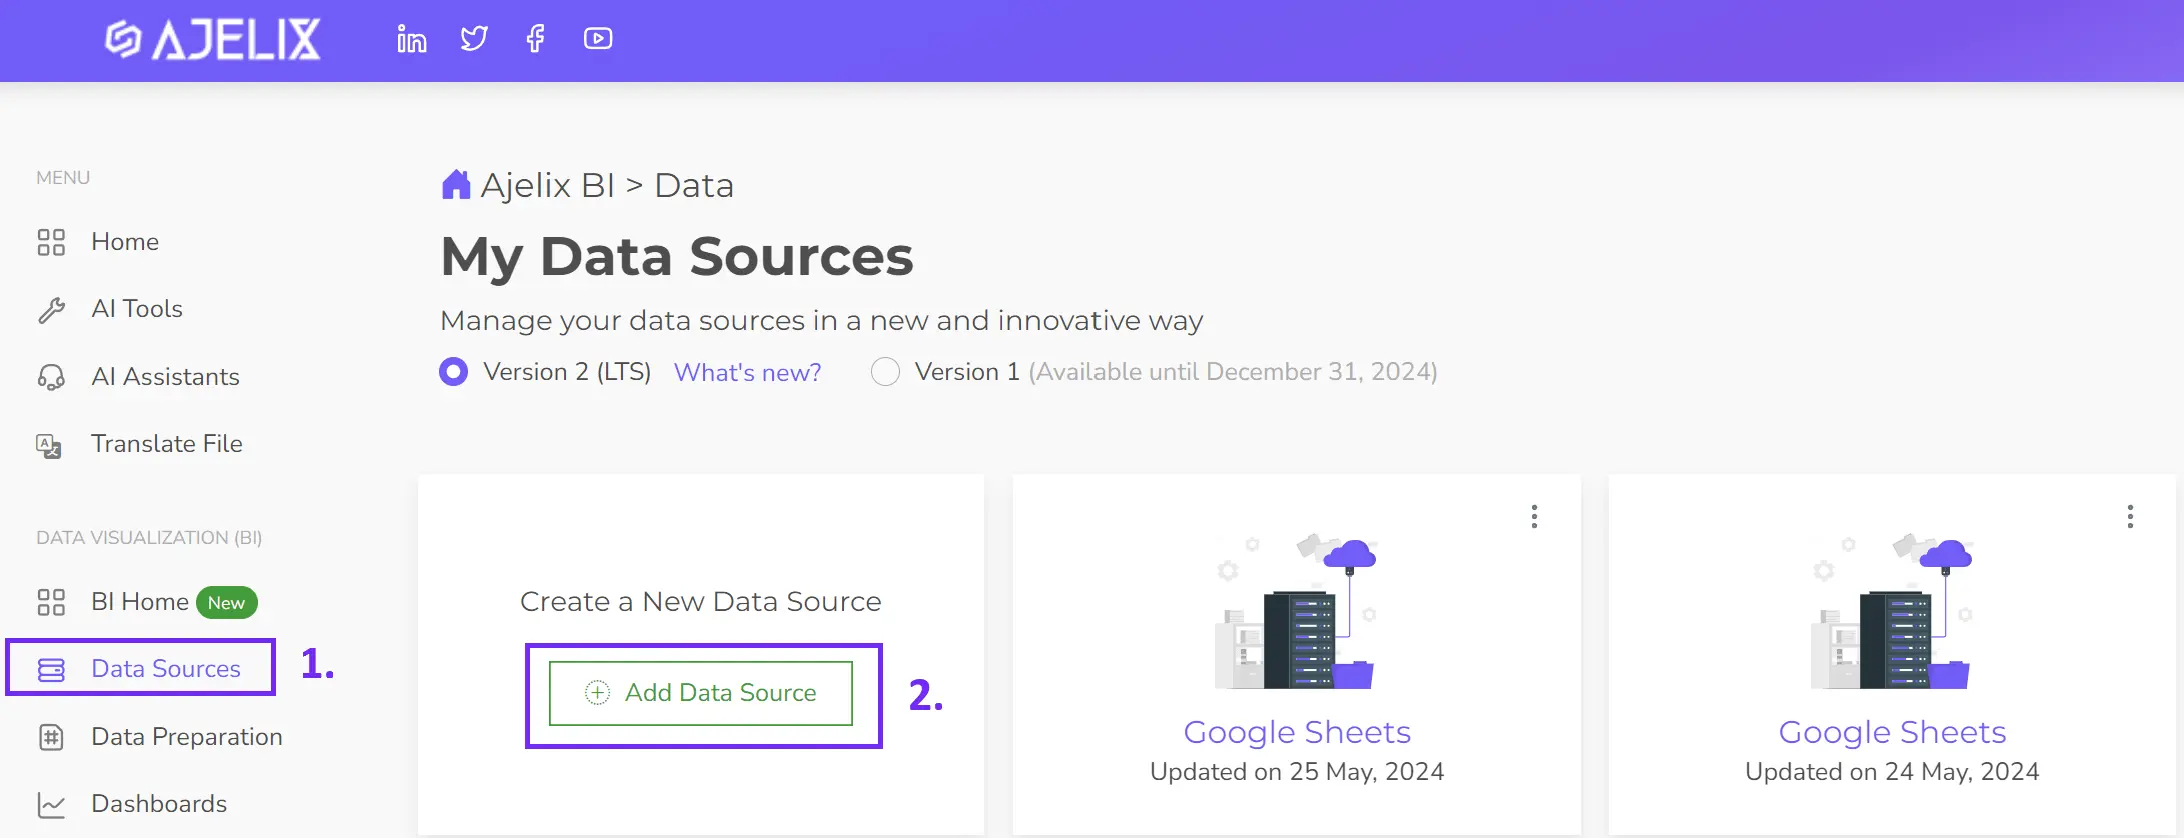
- Connect your data source
The first step in creating a digital dashboard in your BI tool, follow the instructions to connect to your data source. In Ajelix you can simply upload your Excel, CSV, or connect to Google Sheets or SQL server.
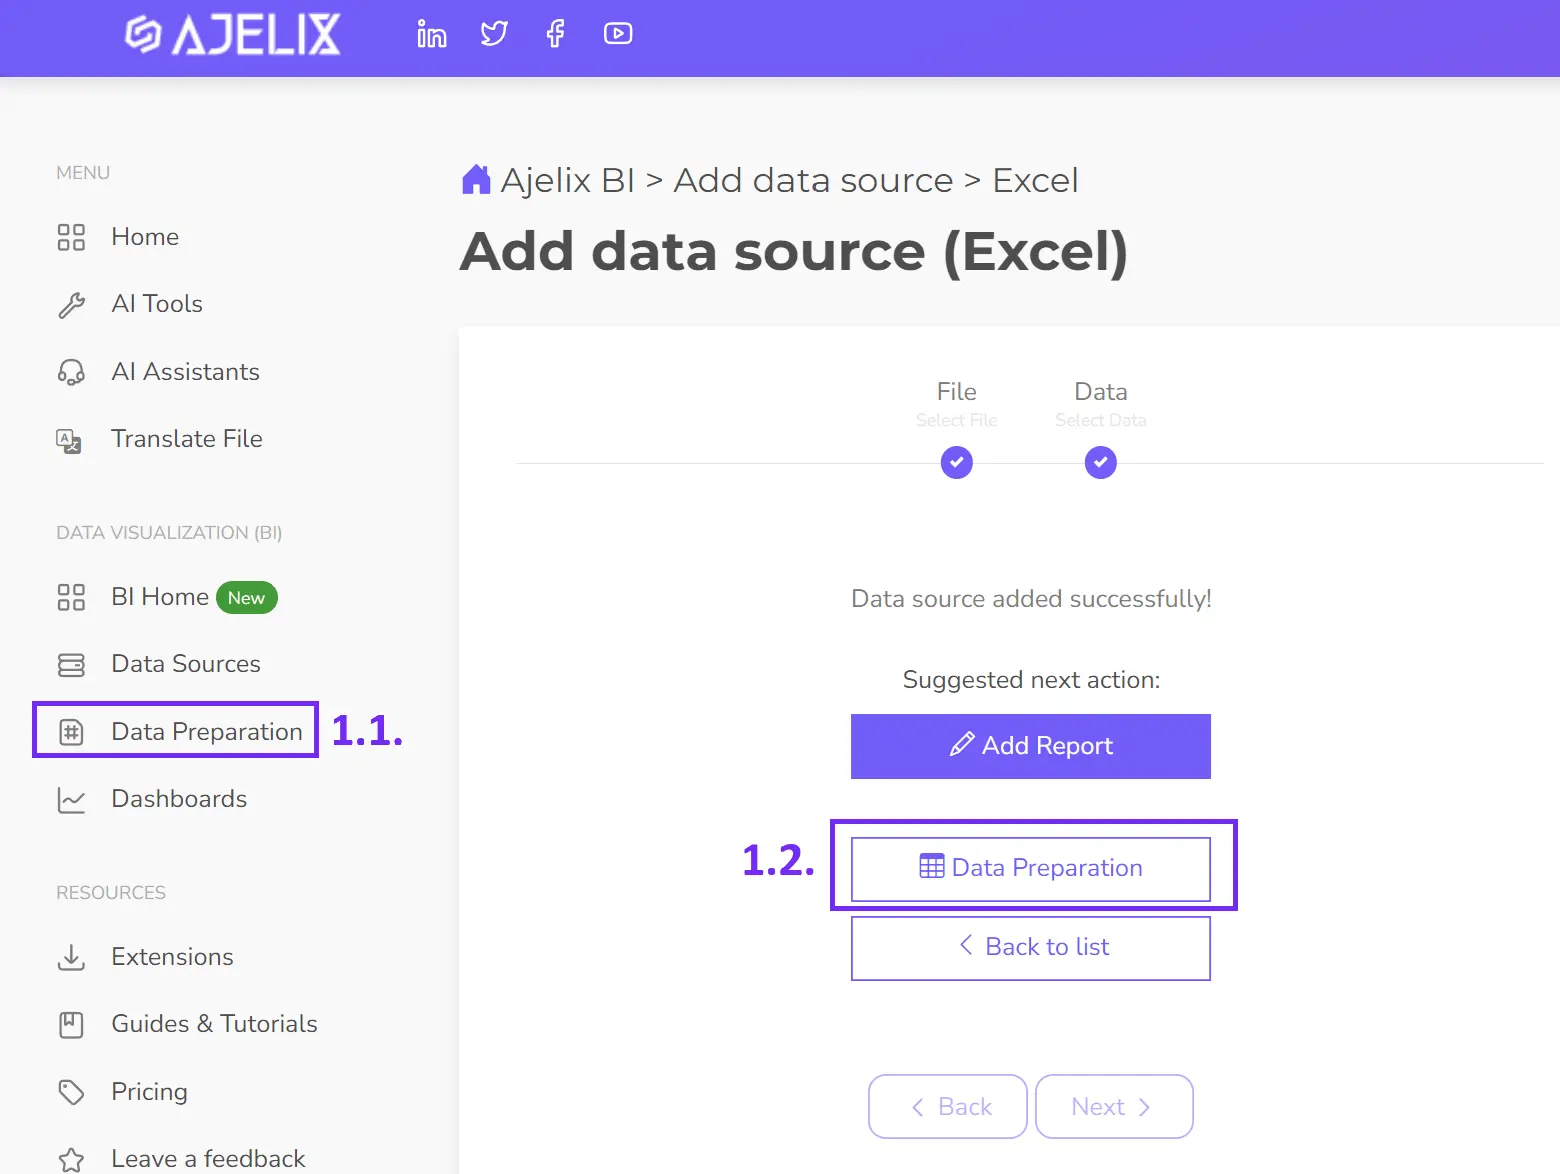
- Clean and transform your data
Ajelix BI allows you to clean or transform your data (e.g., converting formats, filtering). This ensures accuracy and consistency. It’s not a mandatory step but recommended for better analytics.
- Create KPIs
Some KPIs may require custom calculations not directly available in your data source. This article outlined over 10 crucial Admin KPIs calculable with Ajelix BI. The image below illustrates the KPI creation process using data modeling.
1. Select the data source you want to edit
2. Create new measure field
3. Rename the KPI
4. Type in calculation
5. Press apply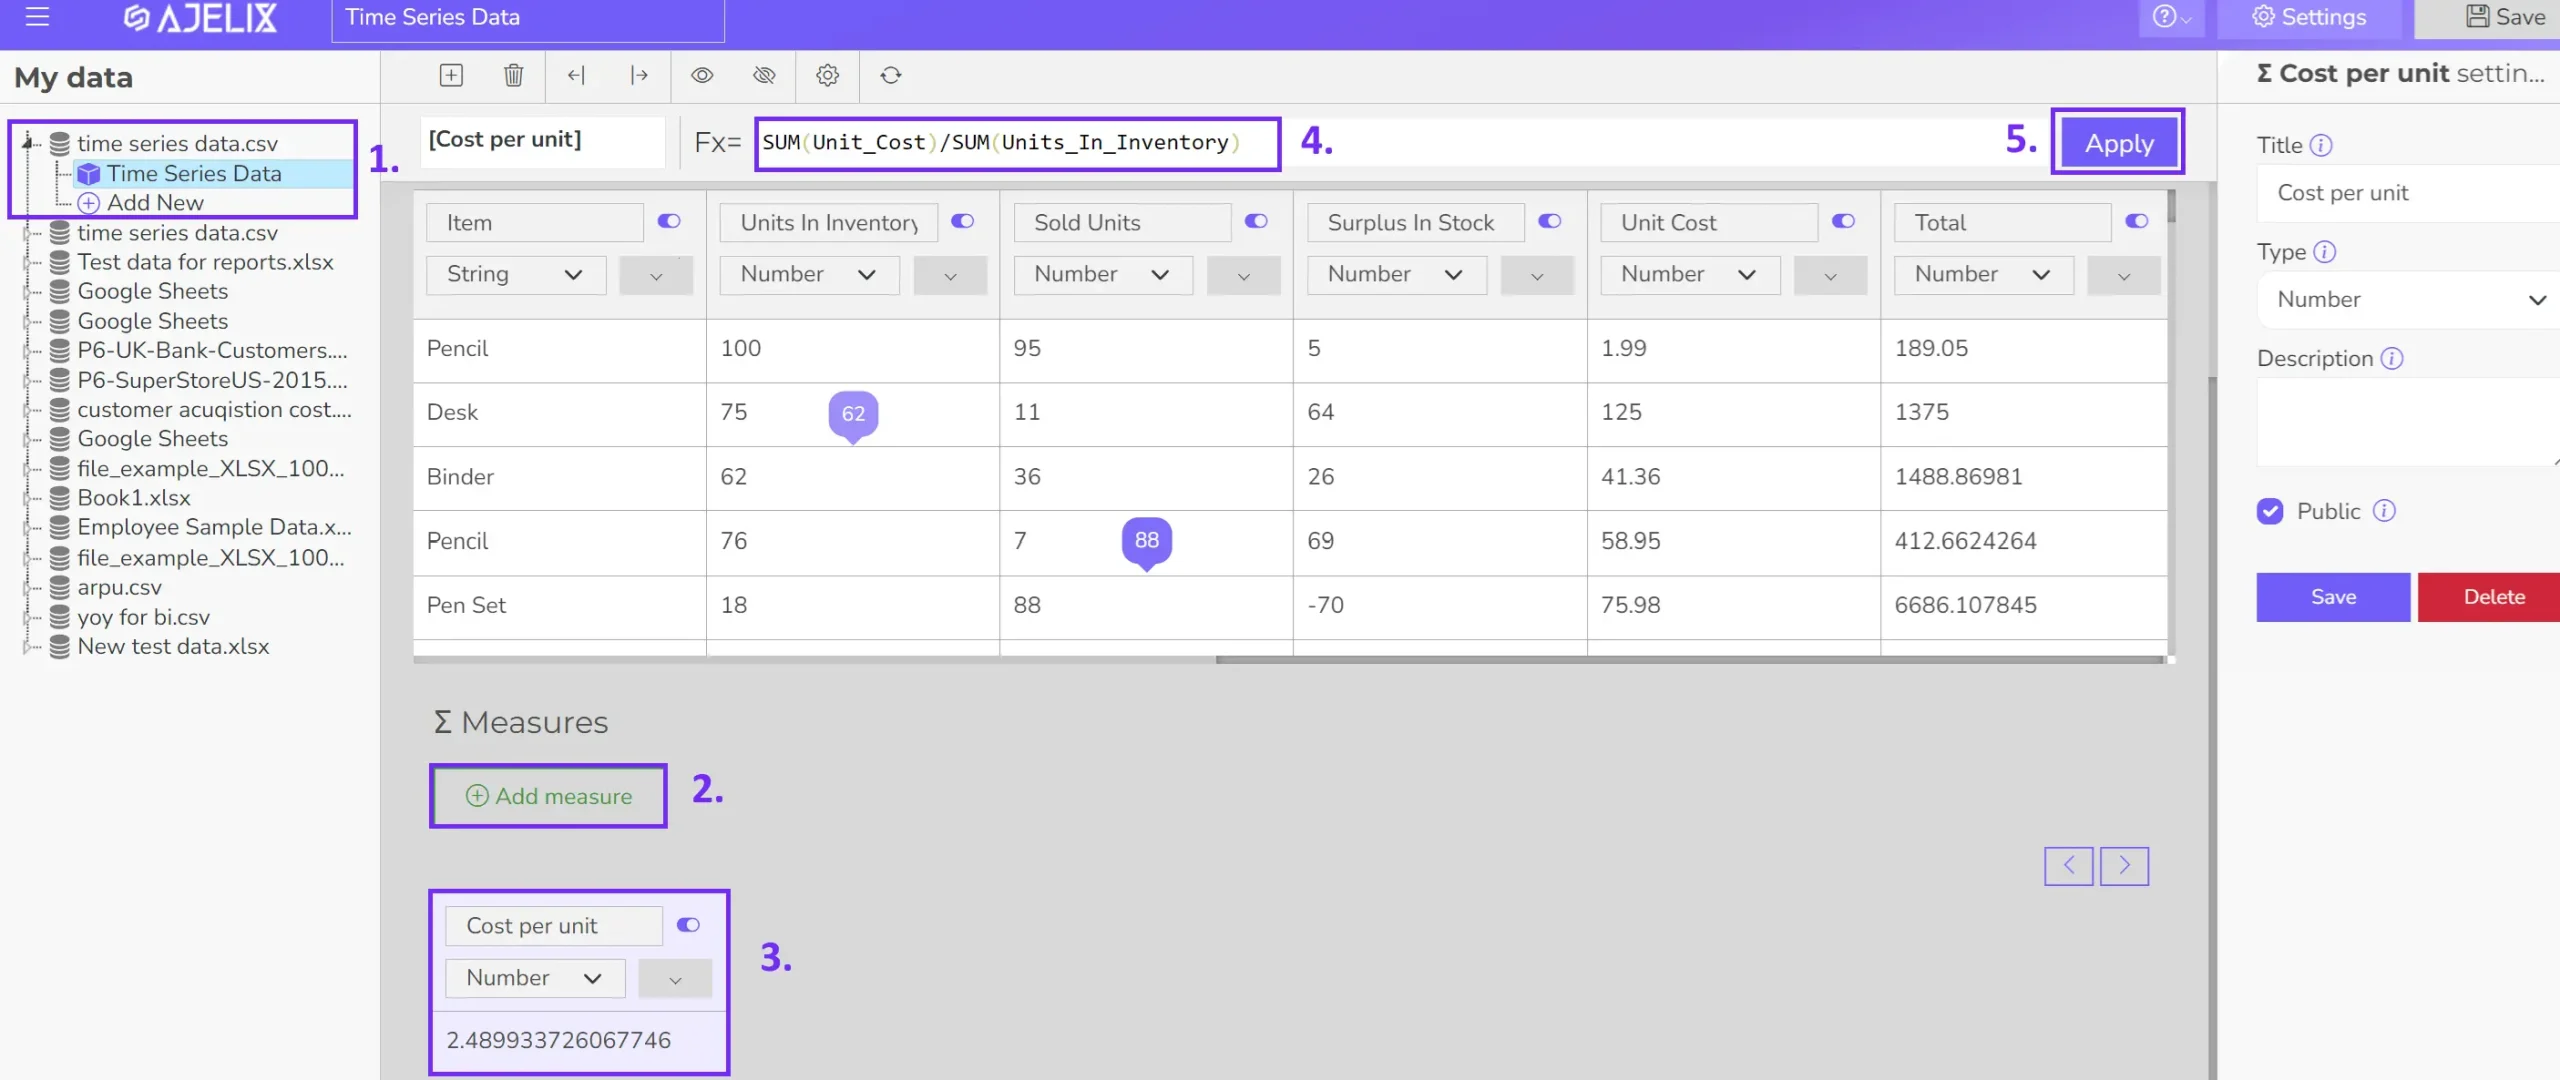
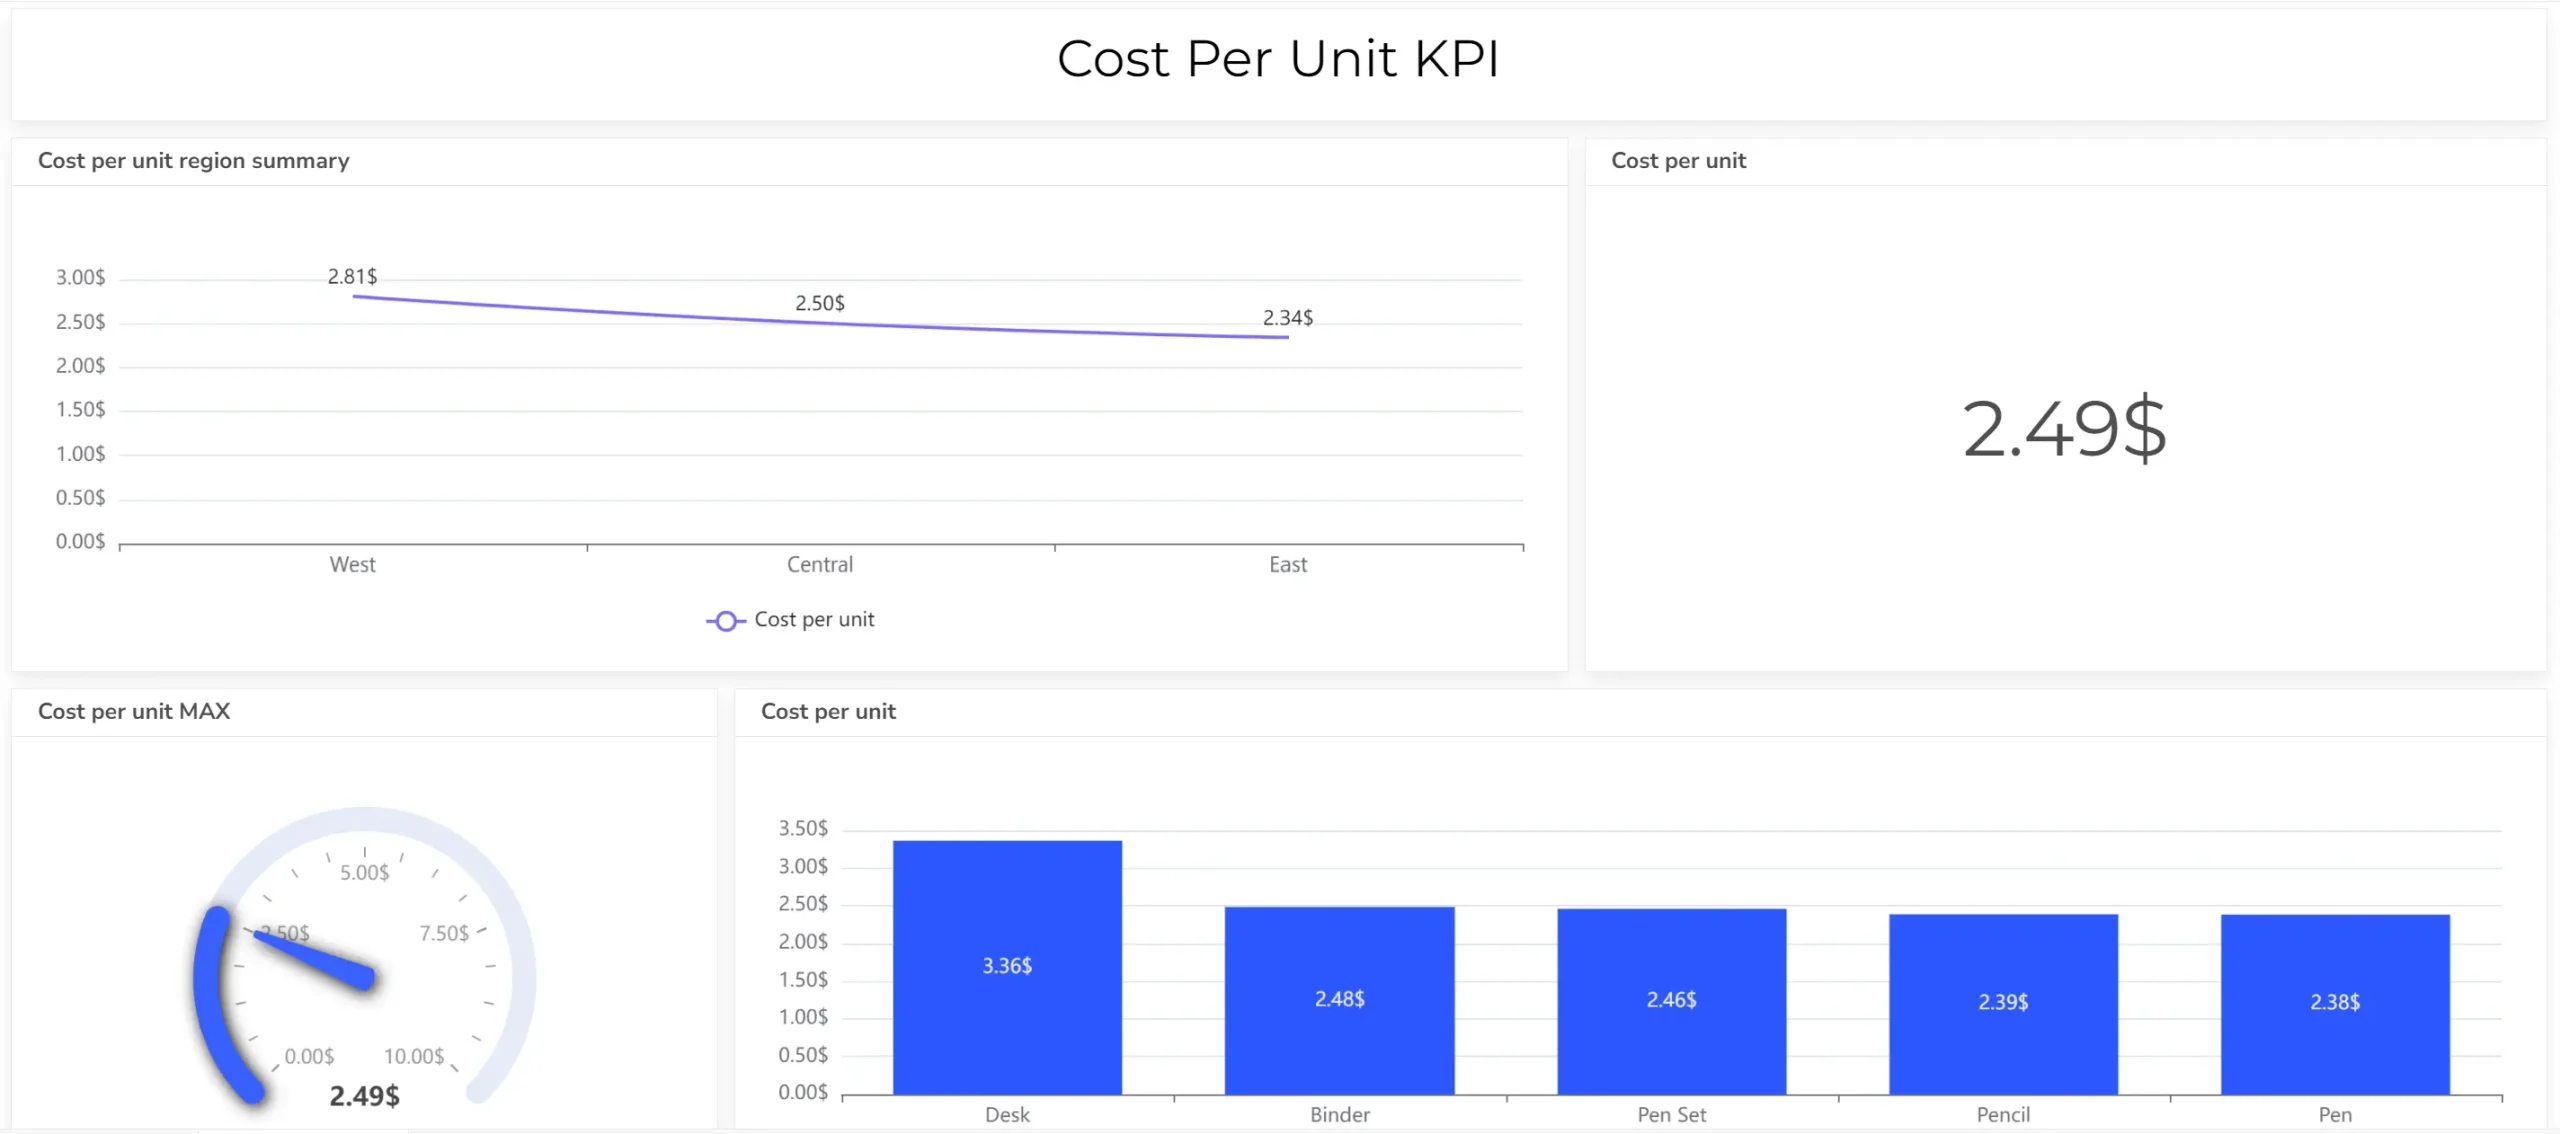
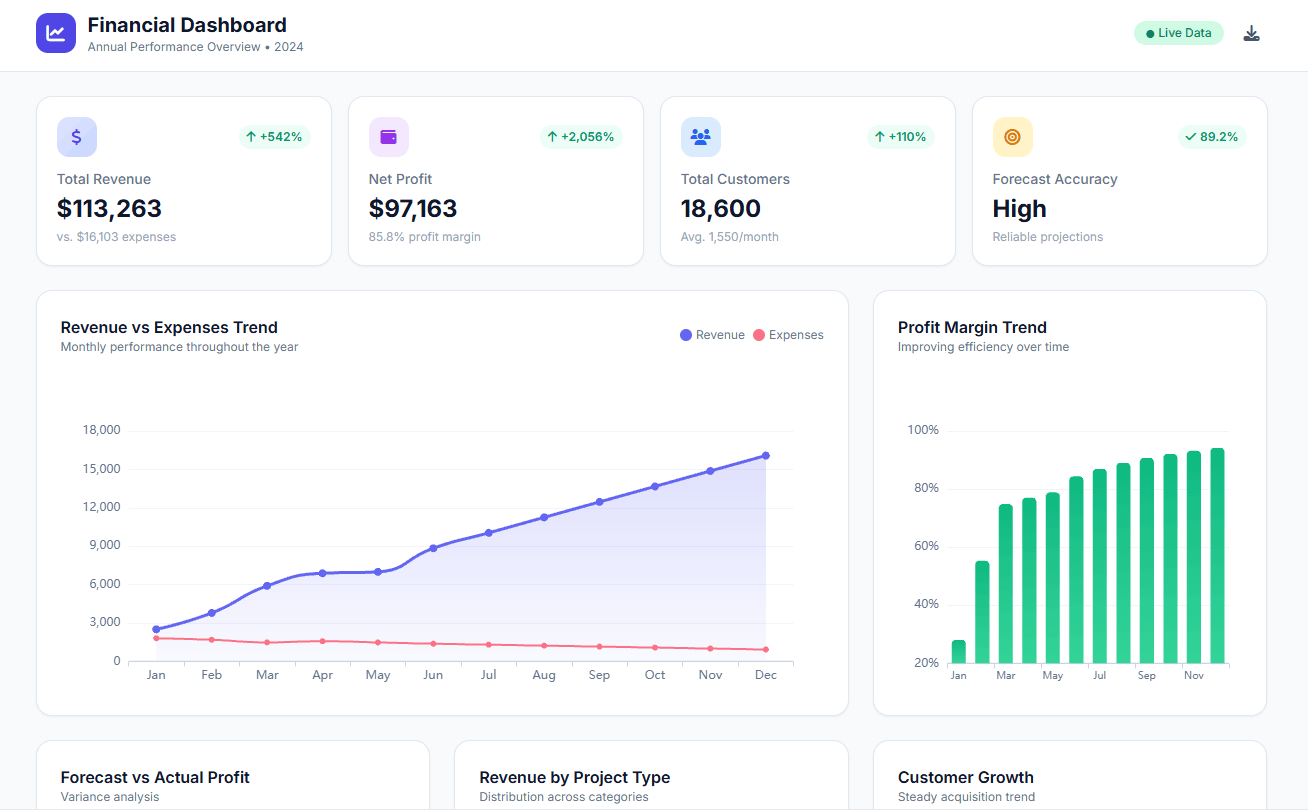
- Build your visualizations
Select the most suitable visual format for each KPI (card, gauge, line graph, etc.). Click on each data column to insert the values in the charts. Ajelix BI even offers an AI-powered dashboard generator that automatically creates charts based on your data.
- Customize your dashboard
Add titles, descriptions, and format the layout for clarity and visual appeal.
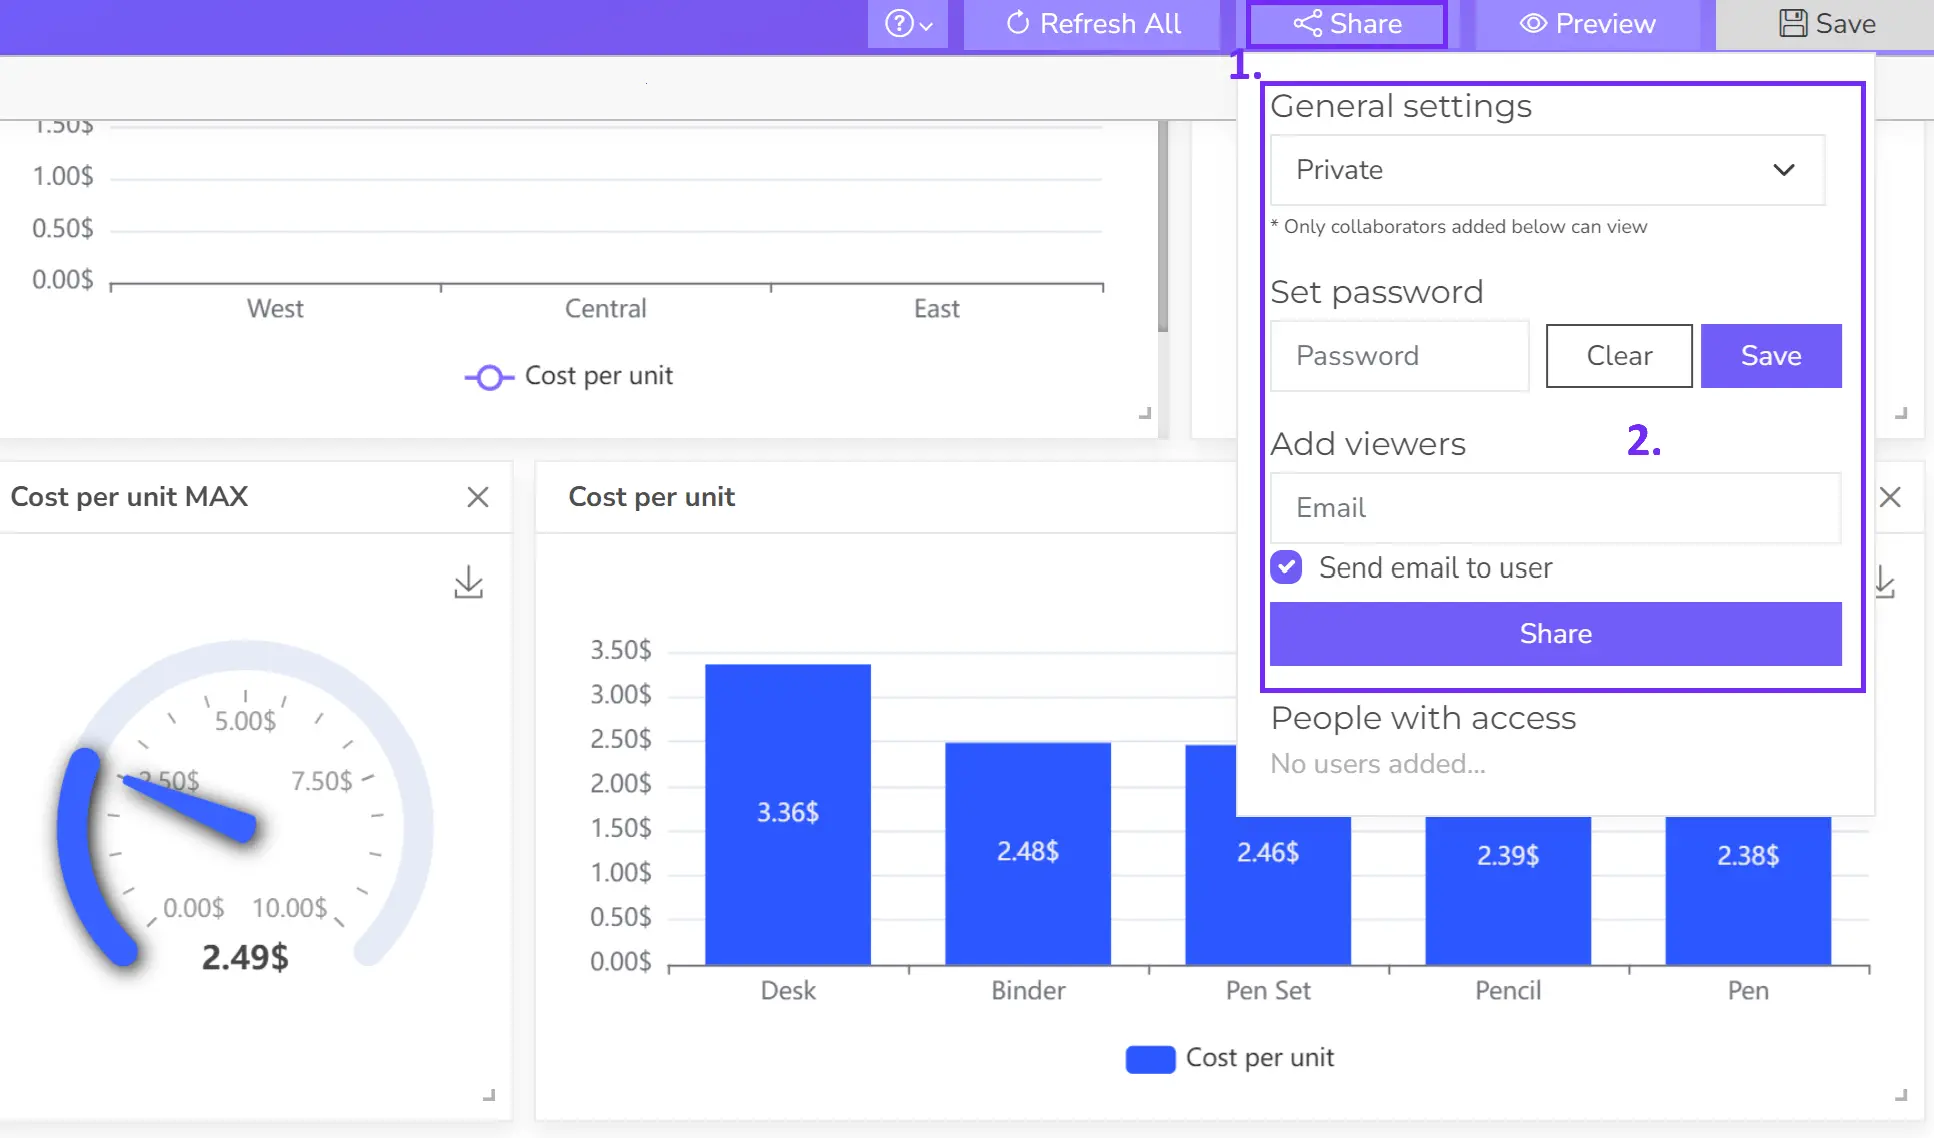
- Share your dashboard
Once happy, publish your dashboard and share it with relevant users for real-time insights.
Struggling with manual calculations & tiring setups?
Let agentic AI do the heavy lifting.
Start free
Fast sign up & easy setup
Tools For KPI Creation And Tracking
The choice of tool for KPI creation and tracking depends on your specific needs, budget, and technical expertise. Here are some popular options categorized by their focus:
Data Analysis and Visualization Tools
- Ajelix BI: Easy-to-use tool with KPI creation, analytics, and visualization features.
- Tableau: Powerful data visualization tool with advanced analytics capabilities.
- Power BI: Microsoft’s business intelligence tool for data analysis and visualization.
- Qlik Sense: Offers data discovery and visualization features.
Dedicated KPI Tools
- Klipfolio: Focuses on creating customizable dashboards and tracking KPIs.
- Databox: Offers data integration, visualization, and KPI tracking capabilities.
Spreadsheet-Based Tools
- Google Sheets: Free and widely used for basic KPI tracking and visualization.
- Microsoft Excel: Offers advanced features for data analysis and visualization.
Reporting gives you a headache?
Upload your data and create professional reports with agentic AI

Start free
Try free and upgrade whenever
Conclusion
Conclusion
By effectively implementing and tracking these 10 administrative KPIs, you can significantly enhance the efficiency and effectiveness of your department.
These metrics provide valuable insights into your team’s performance, helping you identify areas for improvement, optimize resource allocation, and ultimately contribute to the overall success of your organization.
Remember, the key to maximizing the benefits of KPIs lies in continuous monitoring and data analysis.
FAQ
The frequency of measurement depends on the specific KPI and organizational needs. Some KPIs might be reviewed daily, weekly, monthly, or quarterly. Regular review is essential for identifying trends and making necessary adjustments.
Yes, spreadsheets can be used for basic KPI tracking, especially for small teams or departments. However, for larger organizations with multiple KPIs, dedicated KPI tracking software or business intelligence tools might be more efficient.
Employee satisfaction is often measured through surveys or feedback forms. You can use a Likert scale or other rating methods to collect data and calculate average satisfaction scores.
Start by aligning KPIs with your organization’s overall goals. Consider the key functions of your department and identify metrics that measure performance in those areas. It’s also helpful to benchmark against industry standards.
There are various tools available for KPI tracking, from simple spreadsheets to dedicated KPI software. The best tool depends on your specific needs, budget, and technical capabilities. Some popular options include Google Sheets, Excel, Ajelix BI, Klipfolio, and Databox.
From data to report in one minute or less with Ajelix BI