- Home
- Data Visualization
- Tools
- AI Data Analyst
- Excel Formula Generator
- Excel Formula Explainer
- Google Apps Script Generator
- Excel VBA Script Explainer
- Excel VBA Script Generator
- Excel VBA Code Optimizer
- Excel VBA Code Debugger
- Google Sheets Formula Generator
- Google Apps Script Explainer
- Google Sheets Formula Explainer
- Google Apps Script Optimizer
- Google Apps Script Debugger
- Excel File Translator
- Excel Template Generator
- Excel Add-in
- Your Virtual AI Assistant For Excel Spreadsheets
- AI Answer Generator
- AI Math Solver
- AI Graph Generator
- AI SQL Generator
- Pricing
- Resources
What is VAR function in Excel?
VAR function calculates the variance of a sample of data points. It measures how spread out the data is from its mean value, similar to the VARP function.
VAR Function Description
The VAR function in Excel is a versatile tool used to calculate the variance of a data set. This function can be used to determine the measure of the spread of a given set of numbers.
You can use this function to measure any number of data points. It’s an easy-to-use function that requires only two parameters. The first parameter is the range of values that you want to measure and the second parameter is the population that you want to measure. By default, the population is assumed to be the entire range of values.
The function will then calculate the variance for the data set based on the parameters that you have specified. The variance is calculated by first subtracting the mean from each value in the data set. The differences are then squared and added together. The sum is then divided by the number of values in the data set minus one.
It can be used in various ways, such as to measure the spread of a data set, the variability between data points, or the standard deviation of a data set. It’s also used to compare data sets and determine which one has the highest variance.
Struggling with your Excel formulas?
Looking for a faster and easier way to write Excel formulas? Try AI Excel Formula Generator and turn your text into formulas with just a few clicks.
VAR Function Syntax
=VAR(number1, number2, number3, …)
Where “number1, number2, number, …” represents the list of arguments.

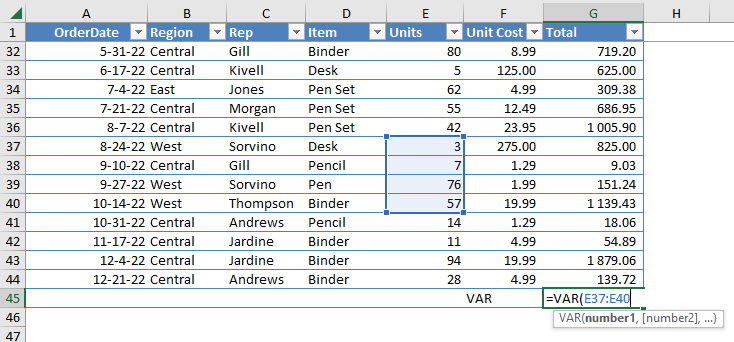
How to use VAR function in your workbook:
- Open Microsoft Excel and enter the information you want to use in the function into the spreadsheet.
- Click on the cell where you want the result of thefunction to appear.
- Enter the formula for the var function in the cell. The syntax is:=VAR(number1, [number2], …)
- Replace the “number1” placeholder with the cell reference of the first cell in the range.
- Optionally, add additional cell references to the formula by entering them after the comma following the first cell reference.
- Close the formula with a closing parenthesis.
- Press “Enter” on your keyboard to calculate the result.
Frequently Asked Questions
The VAR function calculates the variance of a sample of data points, while the VARP function is used to calculate the variance of an entire population. The VAR function uses the sample size minus one in the denominator of the variance formula, while the VARP function uses the total population size.
To calculate variance in Excel, you can use either the VARP or VAR function, depending on whether your data set represents the entire population or a sample of it. Here are the steps to calculate variance using the VAR function as an example:
- Select an empty cell where you want to display the result.
- Type the formula “=VAR(array)” where “array” is the range of cells that contain the data you want to calculate the variance for.
- Press Enter.
Read latest blog articles about Excel
WEEKLY BLOG ARTICLES WITH INDUSTRY NEWS AND HELPFUL GUIDES

Top Automation Tools for Excel in 2025: Built-In and Third-Party Solutions
Written by Signe on . Posted in excel


