- Home
- Data Visualization
- Tools
- AI Data Analyst
- Excel Formula Generator
- Excel Formula Explainer
- Google Apps Script Generator
- Excel VBA Script Explainer
- Excel VBA Script Generator
- Excel VBA Code Optimizer
- Excel VBA Code Debugger
- Google Sheets Formula Generator
- Google Apps Script Explainer
- Google Sheets Formula Explainer
- Google Apps Script Optimizer
- Google Apps Script Debugger
- Excel File Translator
- Excel Template Generator
- Excel Add-in
- Your Virtual AI Assistant For Excel Spreadsheets
- AI Answer Generator
- AI Math Solver
- AI Graph Generator
- AI SQL Generator
- Pricing
- Resources
What is STDEV function in Excel?
STDEV (Standard Deviation) is an Excel function that calculates the standard deviation of a data set. It’s used to measure the degree of variation in a set of values and how far a set of numbers are spread out from their average.
STDEV Function Description
The STDEV function in Excel is a statistical function used to calculate the standard deviation of a set of values. The function takes up to 30 arguments, which can include numbers, ranges, or entire columns or rows of data. The standard deviation is a measure of how spread out the values in a set of data is.
A standard deviation of zero indicates that all values are the same, while a large standard deviation indicates that the values are spread out over a large range of values.
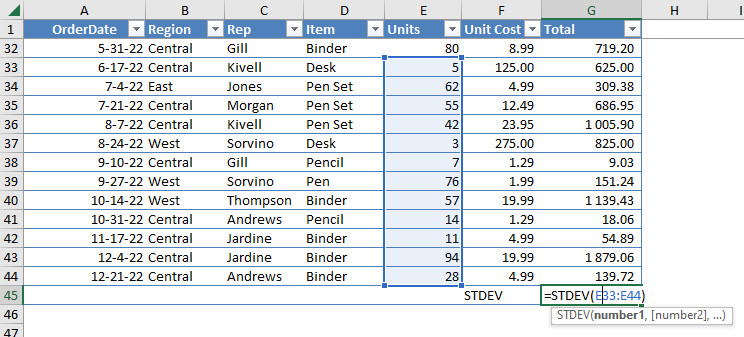
To calculate the standard deviation of a set of values in cells A1 through A5, enter the formula “=STDEV(A1:A5)” in a new cell. The formula will return the standard deviation of the values in the specified range.
As an alternative to entering the formula for each set of values, you can also use the STDEV MS Excel function with the AutoSum button. To use the AutoSum button, select the range of cells you want to measure and click the AutoSum button. The AutoSum button will automatically generate the STDEV formula and display the standard deviation of the values in the range.
In addition to calculating the standard deviation of a set of values, the STDEV MS Excel function can be used to calculate the standard deviation of an entire row or column of data. To calculate the standard deviation of an entire row or column, enter the formula “=STDEV(A:A)”, where A is the column or row you want to measure. The formula will return the standard deviation of all the values in the specified row or column.
However, if you are not familiar with the use of Excel or find this process challenging. Then you can use a standard deviation calculator for quick and accurate results. This calculator is user-friendly and provides the answer by simply inputting your data set. It helps in the understanding of standard deviation by providing detailed steps with graphical image and avoiding the complexities of Excel formulas.
Struggling with your Excel formulas?
Looking for a faster and easier way to write Excel formulas? Try AI Excel Formula Generator and turn your text into formulas with just a few clicks.
STDEV Function Syntax
=STDEV(number1, [number2], …)

How to use STDEV function in your workbook:
- Select the range of cells that contain the data you want to measure.
- Click on the “Formulas” tab in the ribbon -> “More Functions” -> “Statistical” from the list of functions and “STDEV” from the list of statistical functions.
- Enter the range of cells you selected in the “Number 1” box.
- Click “OK” to calculate the standard deviation. The result of the function appears in the cell you clicked on.
Frequently Asked Questions
The standard deviation is a measure of how spread out a set of numbers is from the average or mean. It is calculated by taking the square root of the variance, which is the average of the squared differences from the mean. The standard deviation is a useful statistic because it can help to quantify the amount of variation or dispersion of a set of data values.
The formula for standard deviation in Excel is =STDEV.P(number1,number2,…)
Interpreting the results of a standard deviation calculation depends on the context in which it is being used. Generally, a higher standard deviation indicates a larger range of values, while a lower standard deviation indicates a smaller range of values. This can be used to evaluate the amount of variability in a given dataset, and to compare it to other datasets. For example, if two datasets have a similar mean but one has a higher standard deviation, it is likely that the dataset with the higher standard deviation has a larger overall range of values.
Standard deviation and variance are measures of variability in a set of data. The standard deviation is a measure of the spread of the data, or how far the data points are from the mean. Variance is a measure of the variability of a set of data, or how far the data points are from each other. In other words, standard deviation is a measure of how far the data points are from the mean, while variance is a measure of how spread out the data points are from each other.
Read latest blog articles about Excel
WEEKLY BLOG ARTICLES WITH INDUSTRY NEWS AND HELPFUL GUIDES

Top Automation Tools for Excel in 2025: Built-In and Third-Party Solutions
Written by Signe on . Posted in excel


