- Home
- Data Visualization
- Tools
- AI Data Analyst
- Excel Formula Generator
- Excel Formula Explainer
- Google Apps Script Generator
- Excel VBA Script Explainer
- Excel VBA Script Generator
- Excel VBA Code Optimizer
- Excel VBA Code Debugger
- Google Sheets Formula Generator
- Google Apps Script Explainer
- Google Sheets Formula Explainer
- Google Apps Script Optimizer
- Google Apps Script Debugger
- Excel File Translator
- Excel Template Generator
- Excel Add-in
- Your Virtual AI Assistant For Excel Spreadsheets
- AI Answer Generator
- AI Math Solver
- AI Graph Generator
- AI SQL Generator
- Pricing
- Resources
What is CORREL Function in Excel?
A CORREL function in Excel that calculates the correlation coefficient between two sets of data. It ranges from -1 to 1, with -1 representing a perfect negative correlation, 0 representing no correlation, and 1 representing a perfect positive correlation.
CORREL Function Description
The CORREL function in Excel is a statistical function that returns the correlation coefficient between two sets of data points. A correlation coefficient is a number between -1 and 1 that measures the strength of the linear relationship between two variables.
- Coefficient of -1 indicates a perfect negative linear relationship between two variables.
- A correlation coefficient of 0 indicates no linear relationship between two variables.
- Correlation coefficient of 1 indicates a perfect positive linear relationship.
The CORREL function can be used to measure the strength of the relationship between two sets of data points. This can be useful for predicting the behavior of one variable based on the value of another variable. For example, a correlation coefficient of 0.7 between temperature and air pressure might indicate that the air pressure also rises when the temperature rises.
To use the function, user must specify two sets of data points as arguments. The function will then return the correlation coefficient between the two sets of data points. The data points can be entered as numbers, a range of cells, or an array. The CORREL function is not case-sensitive and ignores the text and logical values.
Struggling with your Excel formulas?
Looking for a faster and easier way to write Excel formulas? Try AI Excel Formula Generator and turn your text into formulas with just a few clicks.
CORREL Function Syntax
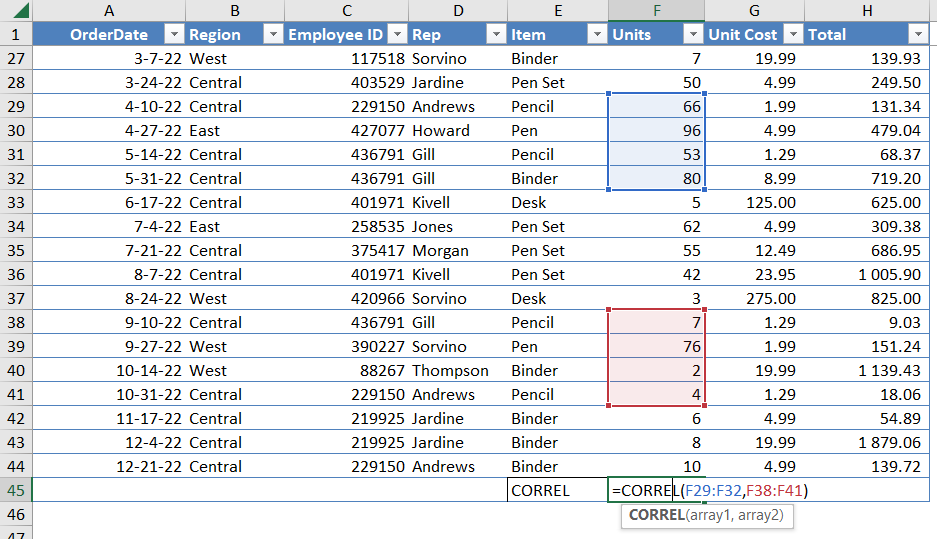
=CORREL(array1, array2)
Arguments:
array1 – The range of cells containing the first set of data.
array2 – The range of cells containing the second set of data.

How to use CORREL function MS Excel in your workbook:
- Open the Excel spreadsheet containing the data you want to analyze using the CORREL function.
- Select the two sets of data that you want to compare.
- Click the “Formulas” tab on the ribbon.
- Click the “More Functions” button in the ribbon.
- Select “Statistical” from the “Select a category” box.
- Select “CORREL” from the “Select a function” box.
- Enter the two sets of data in the “Number 1” and “Number 2” boxes.
- Click “OK” to run the function and display the result in the cell you have selected.
Frequently Asked Questions
The best way to show the correlation between two variables is to create a scatter plot. This will show the relationship between the two variables by plotting their values on a graph. Additionally, you can use a correlation coefficient to measure the strength and direction of a linear relationship between two variables.
- Select the two data sets that you want to calculate the correlation for.
- Click the Data tab, and then click Data Analysis.
- Select the Correlation option and click OK.
- Select the data range for X Range and Y Range.
- Click the Output Range box, and select the cell where the correlation coefficient will be displayed.
- Click OK. The correlation coefficient will be displayed in the output range.
Read latest blog articles about Excel
WEEKLY BLOG ARTICLES WITH INDUSTRY NEWS AND HELPFUL GUIDES

Top Automation Tools for Excel in 2025: Built-In and Third-Party Solutions
Written by Signe on . Posted in excel


