- Home
- Data Visualization
- Tools
- AI Data Analyst
- Excel Formula Generator
- Excel Formula Explainer
- Google Apps Script Generator
- Excel VBA Script Explainer
- AI VBA Code Generator
- Excel VBA Code Optimizer
- Excel VBA Code Debugger
- Google Sheets Formula Generator
- Google Apps Script Explainer
- Google Sheets Formula Explainer
- Google Apps Script Optimizer
- Google Apps Script Debugger
- AI Excel Spreadsheet Generator
- AI Excel Assistant
- AI Graph Generator
- Pricing
- Resources
Explore other articles
- 7 Productivity Tools and AI Plugins for Excel
- Julius AI Alternatives: Top 5 Choices 2026
- No Code Analytics: Top Tools in 2026
- Automation Tools for Excel in 2026: Built-In & Third-Party
- 5 Healthcare Data Analytics Trends 2026
- Best Analytics Platform For Startups In 2026
- 15 Best AI Tools For Startups In 2026 We Tried
- 7 Best AI Tools for Excel Data Analysis (2026 Comparison)
- AI Data Intelligence For Workspace
- Conversational Analytics & AI
Try AI in Excel
Visualizing data is a critical aspect of analysis, and Excel provides a unique way to do this through color coding. By filtering data based on color, you can quickly identify trends and patterns, saving time and making your analysis more insightful. This guide will take you through the intricacies of leveraging Excel’s color-based filtering capabilities for effective data interpretation.
What is Excel’s Color Coding?
Visualizing data is a critical aspect of analysis, and Excel provides a unique way to do this through color coding. By filtering data based on color, you can quickly identify trends and patterns, saving time and making your analysis more insightful. This guide will take you through the intricacies of leveraging Excel’s color-based filtering capabilities for effective data interpretation.
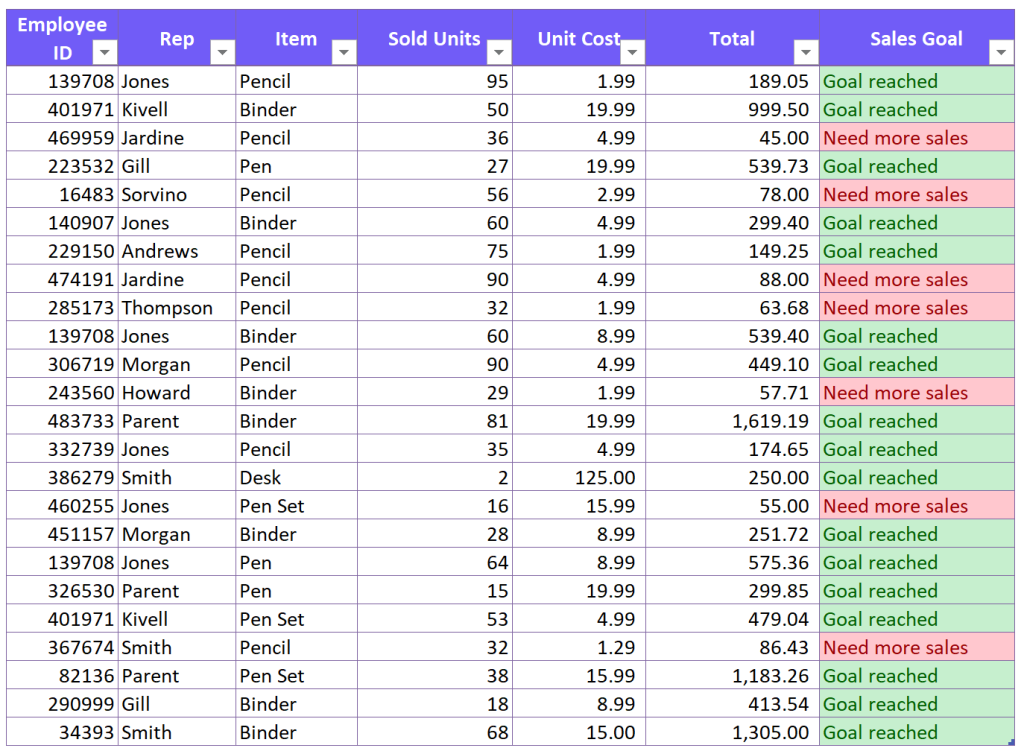
The screenshot above is a great example of how color coding can help gain a visual understanding of data. In the example, we see that some employees didn’t meet the sales goal so you’d need to search a color. It would be helpful to filter by colour and contact those who haven’t reached the goal.
Related Article: How To Remove Conditional Formatting?
How To Filter By Color in Excel?
Excel’s filter rows feature is a powerful tool for data analysis and number filters. With just a few clicks, you can activate Filter option and filter by color and number or access various filter criteria.
Set up Filtering in Your Excel Table
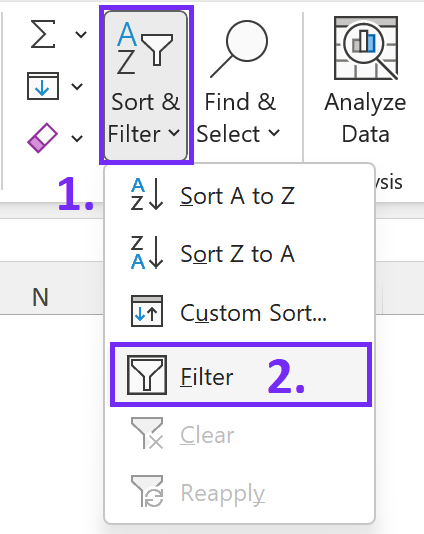
- Click on the table heading where you want to add the filter
- Go to the Excel ribbon Home section
- Choose Sort & Filter
- Click Filter
This basic filtering capability forms the foundation for color-based filtering and automatically sort by color.
Related Article: How To Remove Middle Initial?
How To Start Filtering by Color
The process of filter by cell colour is straightforward but highly effective. You can specify color criteria to filter your data using the Filter feature. This step-by-step guide will walk you through the process, from selecting the Filter option to applying color filters.
Time needed: 1 minute
Best way to filter by background color in your Excel table
- Apply filters in your table
Go to Home, Sort & Filter, and click Filter
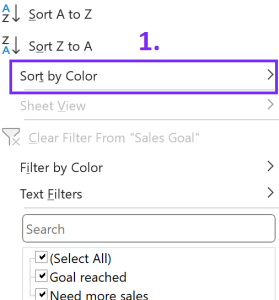
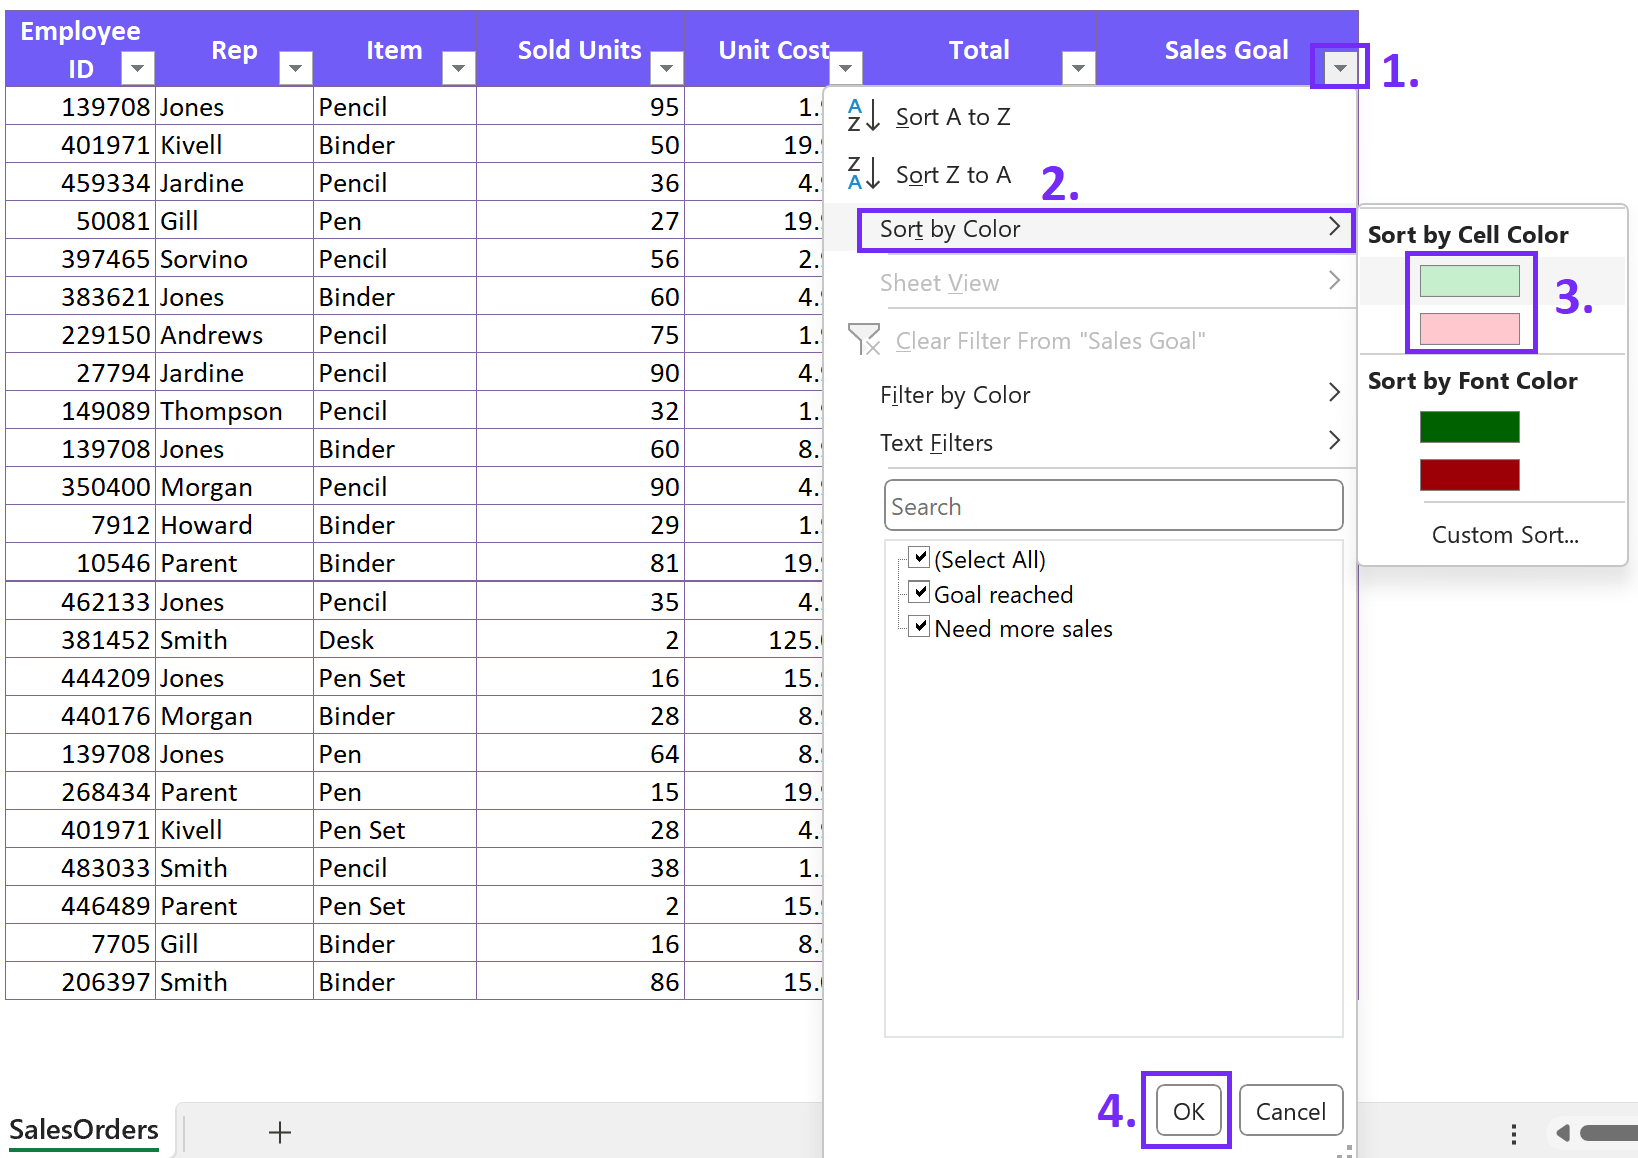
- Choose the column you want to filter and click on the small arrow

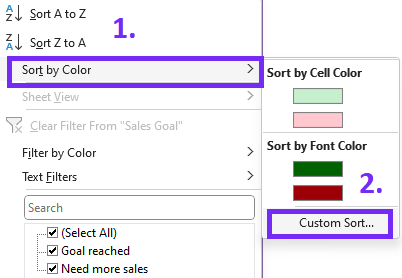
- In the sort dialog box choose Sort Cells By Color
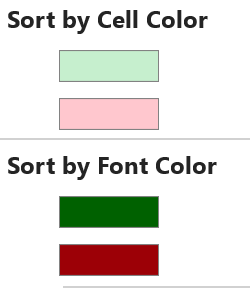
- Choose the color you want to filter by color option
- Press Ok to save changes and filter data in multiple columns by color
Related Article: Move Row in Excel Spreadsheet
Here’s a quick video summary on how to filter by colors:
Advanced Filtering Options by Color
Microsoft Excel provides multiple filtering options that go beyond simple color choices. You can use advanced criteria to filter select cells in the column based on specific shades or a combination of colors. This flexibility allows you to refine your filters to match complex requirements.
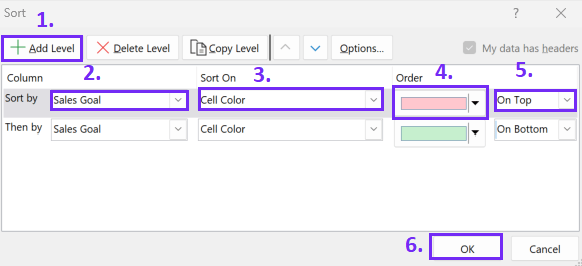
Access Custom Sort settings by color
Once you’ve accessed the Sorting options you can choose how to filter your data from largest to smallest. Add a new level and choose columns you want to filter, pick criteria, and order by colors.
This filtering is very convenient once you have data clustered with many colors and it gets harder to navigate. You can also filter by font color and other criteria.
Related Article: How To Create Excel Template?
Conclusion
The ability to visually categorize and analyze data provides insights that would otherwise be challenging to uncover. To use color-based filtering, apply what you’ve learned to your analyses. Filter data by color is available for Excel 365 and other Excel Windows versions. You can also cancel filter by color.
FAQs
Absolutely! Combining color filters with text, numbers, or other criteria is a powerful way to refine your results further.
Yes, it is indeed possible to sort and filter data in Excel based on cell color. Excel’s standard filter options can sort and filter text, numbers, and dates. You can also use “Custom Sort” and “AutoFilter” to sort and filter by cell color.
To sort by cell color:
1. Select the column containing the colored cells that you want to sort.
2. Go to the “Data” tab in the Excel ribbon
3. Click on the “Sort” button
4. In the “Sort Options” dialog box, choose the “Cell Color” option from the “Sort On” dropdown.
5. Select the color you want to sort by from the “Order” dropdown
6. Click “OK” to apply the sort.
To clear sort by color filters, access filtering options, click on Sort by Color, Custom Sort, and press Delete level. Now you have removed the sort by color filters.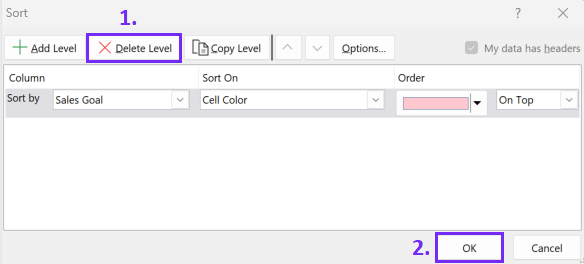
References
Speed up your spreadsheet tasks with Ajelix AI in Excel
