- Home
- Data Visualization
- Tools
- AI Data Analyst
- Excel Formula Generator
- Excel Formula Explainer
- Google Apps Script Generator
- Excel VBA Script Explainer
- Excel VBA Script Generator
- Excel VBA Code Optimizer
- Excel VBA Code Debugger
- Google Sheets Formula Generator
- Google Apps Script Explainer
- Google Sheets Formula Explainer
- Google Apps Script Optimizer
- Google Apps Script Debugger
- Excel File Translator
- Excel Template Generator
- Excel Add-in
- Your Virtual AI Assistant For Excel Spreadsheets
- AI Answer Generator
- AI Math Solver
- AI Graph Generator
- AI SQL Generator
- Pricing
- Resources
Explore other articles
- No Code Analytics: Business Impact and Top Tools in 2025
- Top Automation Tools for Excel in 2025: Built-In and Third-Party Solutions
- 5 Healthcare Data Analytics Trends 2025
- Which is the Best Analytics Platform for Startup Data Needs in 2025
- 10 Must-Have AI Tools for Startups in 2025
- 7 Best AI Tools for Excel Data Analysis (2025 Comparison)
- Why is AI-driven Data Intelligence the Key to Success?
- The Essential Role of AI in Conversational Analytics
- Which AI Model Will Survive Our Test: Claude vs Perplexity?
- Will AI Replace Data Analysts?
Try AI in Excel
Excel is a powerful tool for managing and analyzing data. Excel’s key feature is creating charts that help Excel users with data visualization clearly. Sometimes charts need to be deleted in Excel, either due to errors or because they are no longer needed. This article provides a guide on deleting a chart in Excel with step-by-step instructions, tips, and troubleshooting advice.
Identifying the Chart to Delete
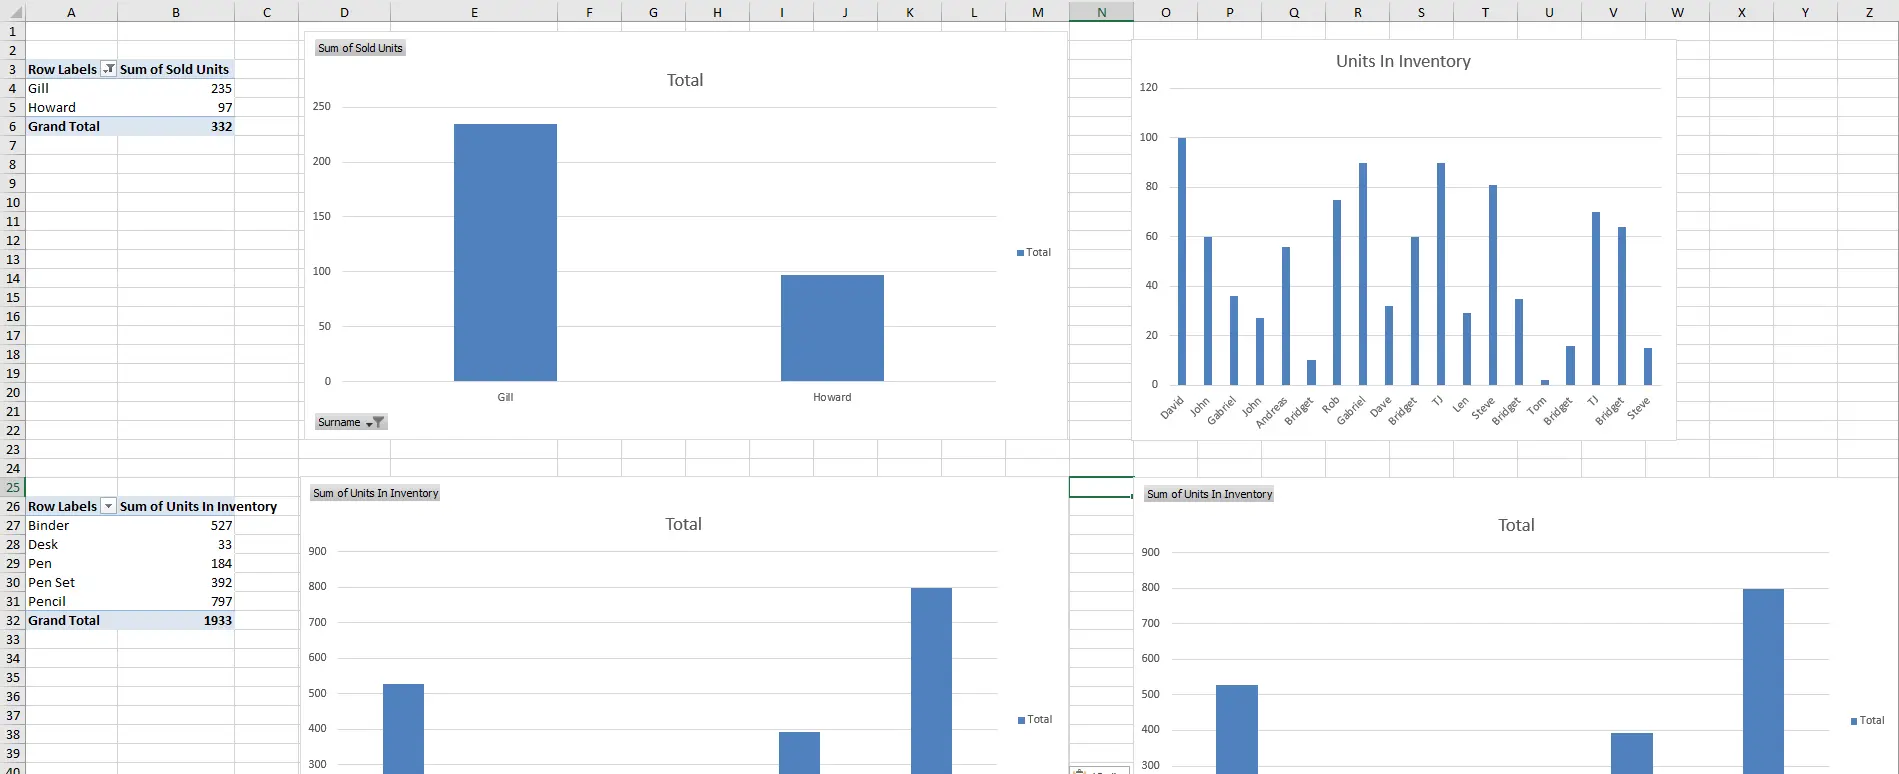
Before you can delete a chart in Excel, you’ll need to locate it on the worksheet. This may involve scrolling through a large dataset or navigating to a different sheet within the workbook. Additionally, it’s important to understand the different types of charts available in Excel. Such as line, bar, and pie charts, so that you can properly identify the chart you want to delete.
How to Delete a Chart in Excel
Time needed: 2 minutes
To Delete a Chart in an Excel spreadsheet
- Locate the graph
Once you’ve located the charts and graphs you want to delete, the process of deleting them is straightforward.
- Select the graph and press the Delete keyboard
Once you have selected the chart click on it. Find the “Delete” button on your keypad and click on it. As there’s no such option in Excel to press the delete button you have to use a keyboard shortcut.
Related Article: How To Remove Conditional Formatting in Excel
In addition to the basic method described above, there are several other ways to delete a chart show in Excel. For example, you can use a keyboard shortcut (Alt + F1) to quickly delete the selected chart.
Related Article: Delete Rows in Excel
Move Chart in Excel
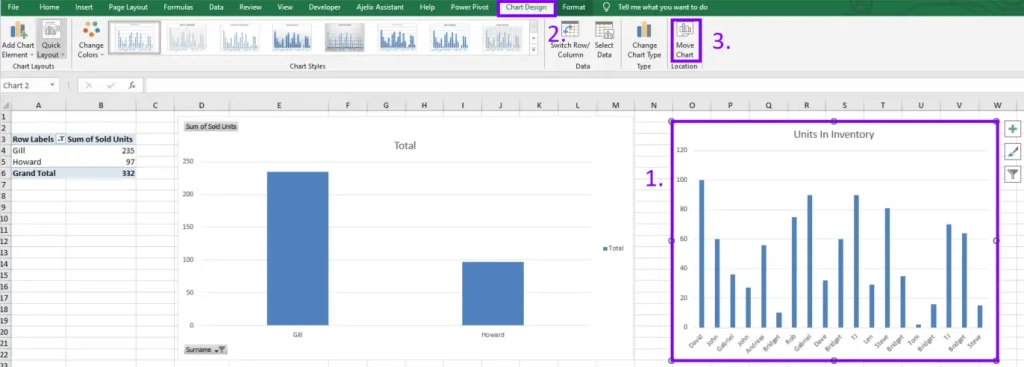
Alternatively, you can move a chart to another sheet, which appears when a chart is selected. To do it click on your chart “Design” tab will appear and click on “Move Chart”.
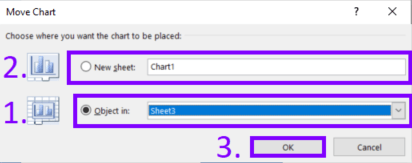
After click on move chart a dialog box with additional settings should appear. Choose the new location and click OK.
Related Article: REF Errors in Excel. Causes and Fixes.
Deleting Multiple Charts at Once
If you need to delete multiple charts at once, there are a few different methods you can use. Select all of the charts you want to delete by holding down the Shift key and selecting each chart. Then, use the Delete button on your keyboard to remove all selected charts at once.
Alternatively, you can use other methods such as the Objects pane. Another option is VBA (Visual Basic for Applications) code to delete multiple charts at once.
Related Article: Excel Doesn’t Save Formatting. How To Solve?
Tips for Deleting Charts in Excel
While deleting a chart may appear simple, it’s important to consider a few things to ensure it’s done correctly. It’s a good idea to double-check the chart before deleting it to ensure you’re deleting the correct one.
Additionally, it’s wise to save a copy of the worksheet before making any changes. In case you need to revert back to an earlier version. Remember that deleting a chart can affect other parts of the worksheet, like formulas or links to common types of data.
Related Article: How To Switch Rows and Columns in Excel?
Common Issues When Deleting Charts in Excel
While deleting a chart in Excel is generally a straightforward process, there are a few common issues that can arise. Every user knows that the right mouse button provides a wide range of options but in this case, it doesn’t provide a delete option. Additionally, deleting charts that are connected to other data labels in the worksheet can cause errors or unexpected behavior.
Related Article: How To Save When Excel is Not Responding?
Troubleshooting Issues with Deleting Charts in Excel
If you do encounter issues when deleting charts in Excel, there are a few steps you can take to troubleshoot them. For example, if you accidentally delete a chart, you may be able to recover it using the Undo function (Ctrl + Z). Alternatively, if deleting a chart causes errors in the worksheet. You may need to check for any formulas or links that are referencing the deleted chart and update them accordingly.
Related Article: Is Microsoft Excel still relevant in 2023?
Conclusion
Deleting charts in Excel is important for organizing data and creating better worksheets. By using the steps provided in this guide, you can swiftly delete any unwanted charts from your workbook. Charts including radar charts, scatter plots, bar charts, line graphs, bar graphs, and stacked bar charts are integral parts of data analytics.
Remember to take extra care when deleting charts and be sure to double-check that you are deleting the correct chart. Additionally, it is always a good idea to save a copy of your worksheet before making any changes.
If you have trouble deleting charts, like accidentally removing the wrong chart or part, there are solutions you can try. You can recover deleted charts in Excel and fix any errors that may occur as a result of deleting a chart.
Struggling with your Excel formulas?
Looking for a faster and easier way to write Excel formulas? Try AI Excel Formula Generator and turn your text into formulas with just a few clicks.
By following the steps and tips in this guide, you can delete Excel charts correctly and become better at using Excel. Check out helpful online tutorials and guides for more resources on Excel charting and worksheet management.
Learn more about Excel and Google Sheets hacks in other articles. Stay connected with us on social media and receive more daily tips and updates.
Frequently Asked Questions
Yes, you can use a keyboard shortcut to delete a chart in Excel. Simply select the chart you want to delete and press the “Delete” key on your keyboard.
Yes, it is possible to delete multiple charts at once in Excel. Select charts while holding the “Ctrl” key or select a group of charts by clicking and dragging your mouse. Once you have selected the charts you want to delete press the “Delete” key on your keyboard. Or use the “Delete” button in the “Home” tab of the Excel ribbon to remove them all at once.
Speed up your spreadsheet tasks with Ajelix AI in Excel
