Convert Row To Column In Excel

Converting rows to columns in Excel means rearranging your data so that what was previously in rows is now displayed in columns, and vice versa. This is helpful when you have data that would be better presented in a different orientation for easier reading or analysis.
Do you struggle with an Excel spreadsheet that looks like a tangled web of rows rather than a neat data arrangement? In this article, we will learn how to use Excel to change data from rows to columns.
The Difference Between Rows vs. Columns
Rows are horizontal lines (like shelves on a bookcase) holding your data entries in Excel, while columns are vertical categories (like sections on a shelf) that define those entries. The key difference between rows and columns in Excel lies in their direction:
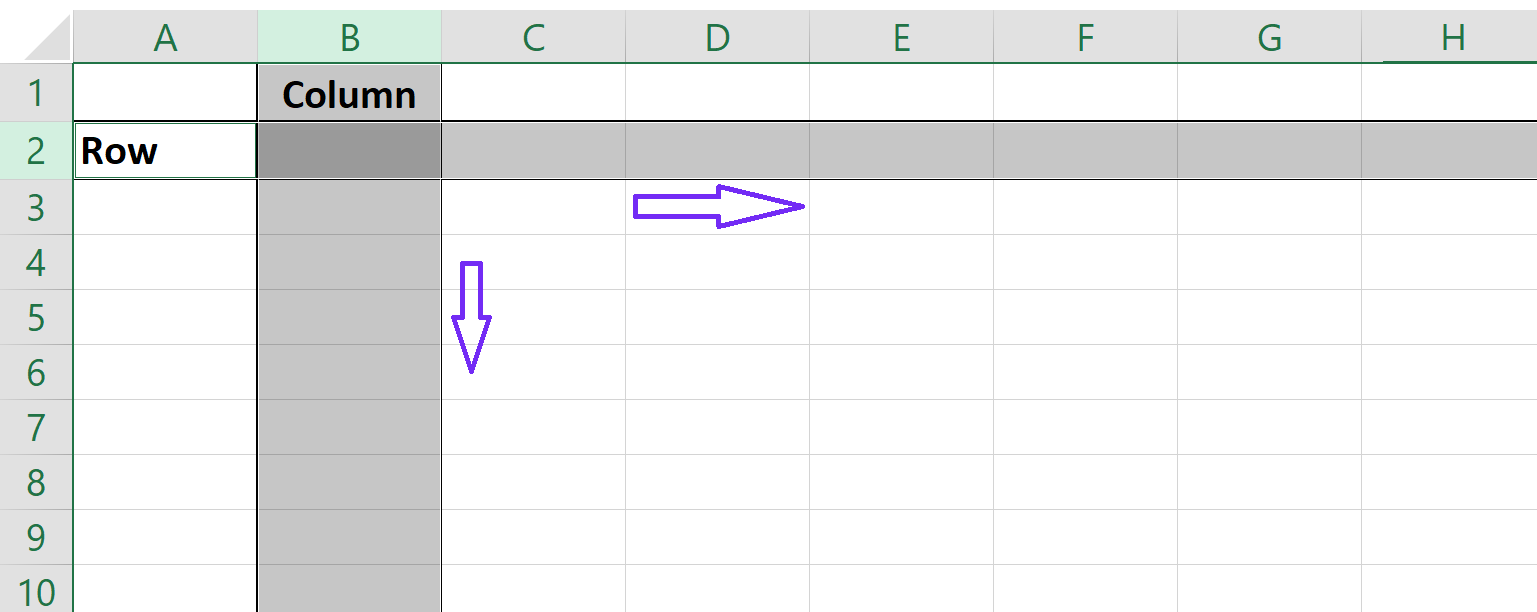
- Rows: Rows run horizontally across the spreadsheet, from left to right. They typically represent individual records or entries in your data set. Imagine them as shelves in a library.
- Columns: Columns run vertically down the spreadsheet, from top to bottom. They categorize your data by specific attributes or variables. Think of them as sections within each shelf holding related information.
How To Convert Row To Column In Excel
Time needed: 5 minutes
Here’s a step-by-step guide on how to convert row to column in Excel.
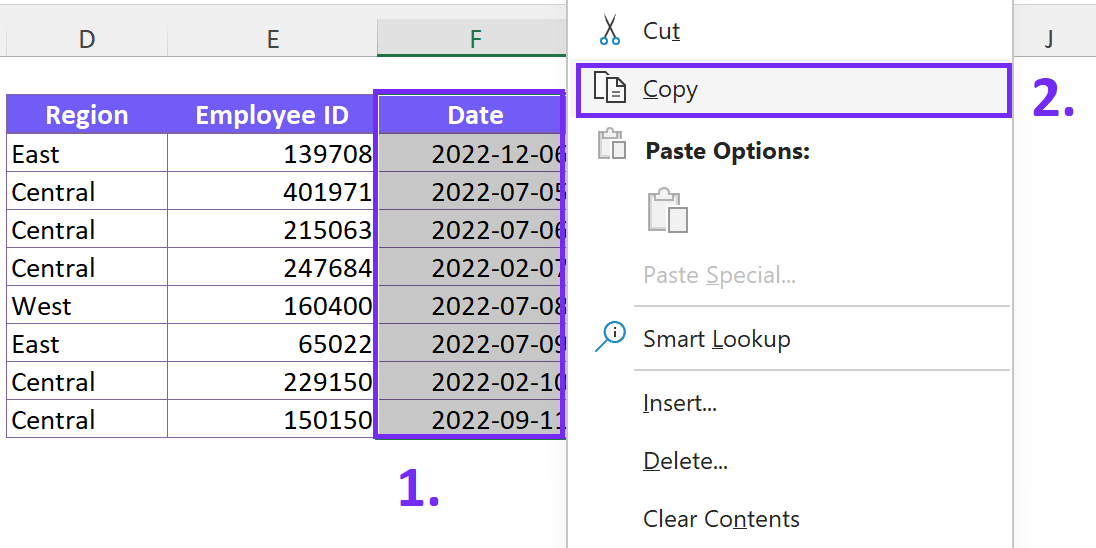
- Select and Copy
To select your dataset, click and drag the mouse from the top-left cell to the bottom-right cell. Once the data is highlighted, press “Ctrl+C” or right-click and choose “Copy.”
- Choose the Destination
Next, decide where you want the converted data to appear. It could be a new sheet or an empty region on the same sheet. Click on the cell where you want the top-left cell of your transformed data to be.
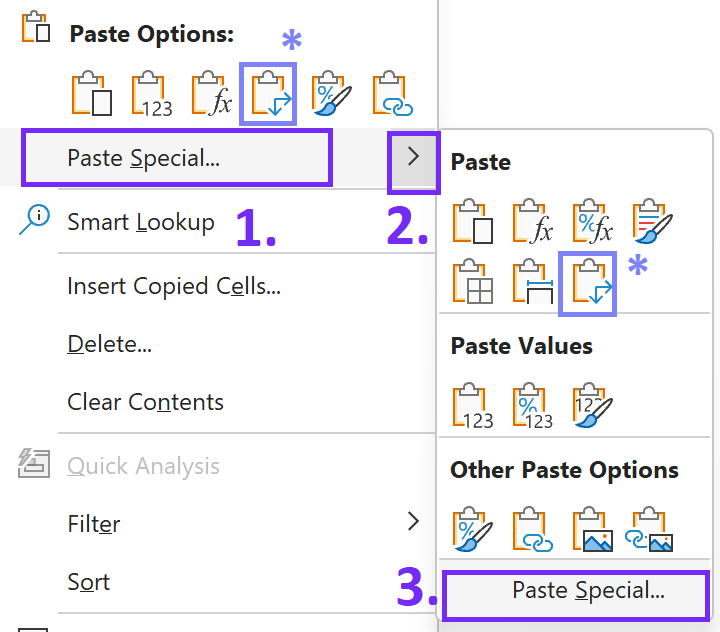
- Use Transpose Feature
Right-click on the cell you selected as the starting point of your converted data. In the context menu, navigate to “Paste Options,” and you’ll see various paste options. Look for the “Transpose” icon – it looks like two intersecting arrows – and click on it or follow steps bellow.
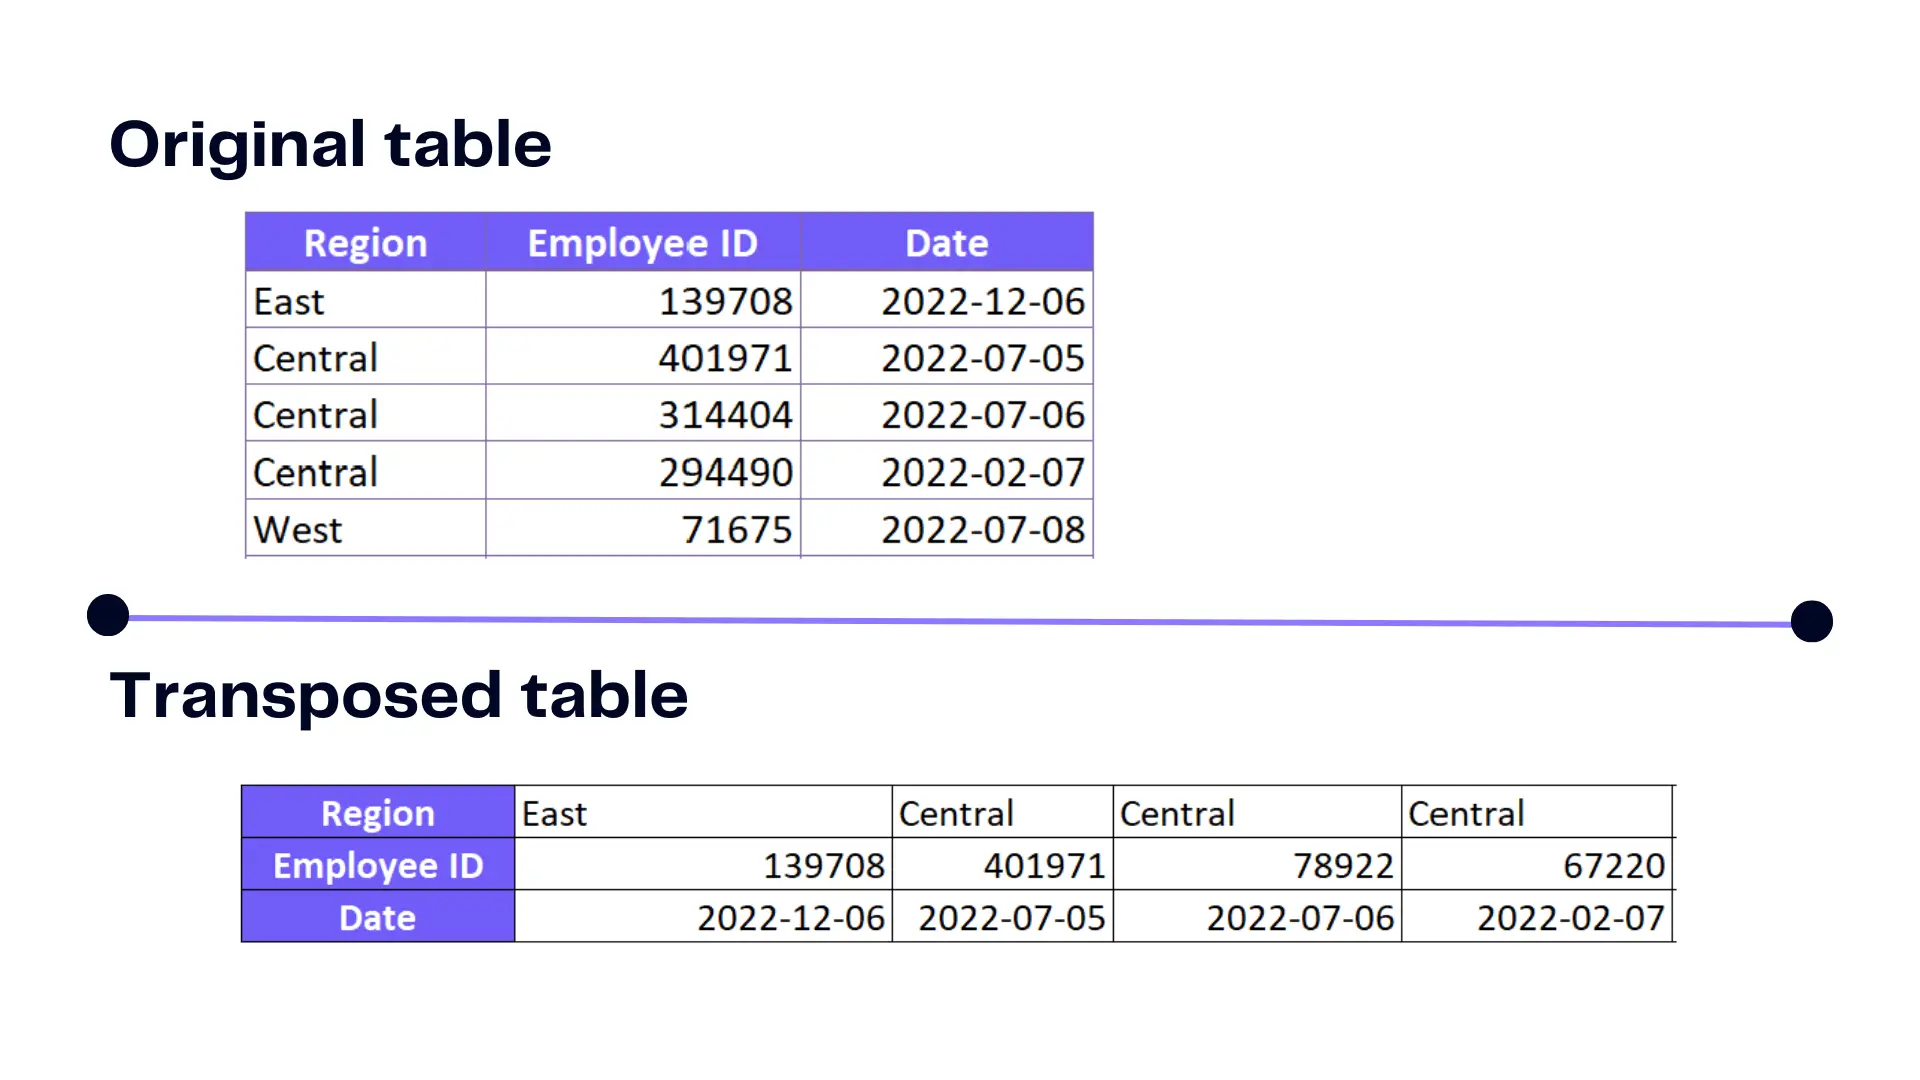
- Get transposed table
Once, you used the function you should have a transposed table, like in the example below
Related Article: How To Change Page Orientation To Landscape?
Here’s a quick video summary on how to convert the column into a row. You can use the same functionality to convert row to column.
Use Excel Formula To Transpose Row to Column
You can use a command to convert a group of rows into a single column using the Excel formula. This formula will also work into converting columns to rows.
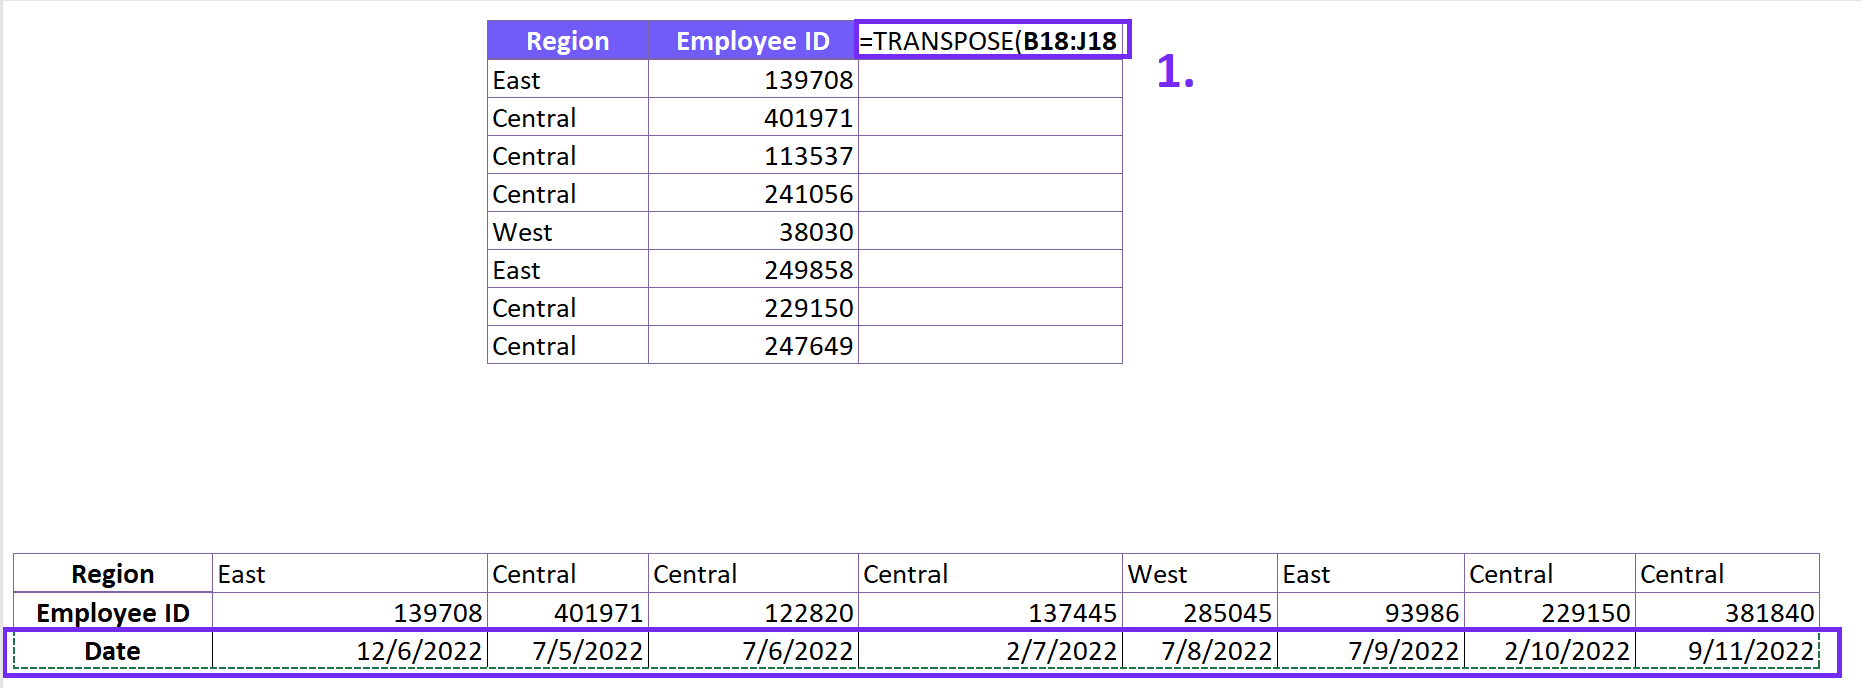
=TRANSPOSE(array)
Insert multiple rows and use the transpose function to level up statistical analysis.
Convert Survey Data
Let’s put the magic of converting rows of data to columns into practice with a real-life example. Imagine conducting a survey to collect feedback from your customers and recording the responses in a row-oriented format. Each row represents a participant, and the columns contain various answers to questions asked during the survey.
The Raw Data
| Participant | Age | Gender | Satisfaction | Recommendation |
|---|---|---|---|---|
| John | 32 | Male | 4.5/5 | Yes |
| Sarah | 28 | Female | 4.0/5 | Yes |
| Mike | 45 | Male | 3.8/5 | No |
The Transformation
To make sense of this data, you decide to convert it into a columnar layout. This will enable you to analyze the responses more efficiently. After selecting the data and copying it, you choose a new destination and use the “Transpose” feature. The data transforms into a more insightful format.
| Participant | John | Sarah | Mike |
|---|---|---|---|
| Age | 32 | 28 | 45 |
| Gender | Male | Female | Male |
| Satisfaction | 4.5/5 | 4.0/5 | 3.8/5 |
| Recommendation | Yes | Yes | No |
Now, analyzing the responses becomes a breeze! You can quickly compare and contrast the satisfaction levels and recommendations across different participants.
Related Article: How To Remove Middle Initial?
Let’s Up the Game: Complex Data Sets
You might wonder if you can turn horizontal rows to vertical columns with simple datasets. Fear not! This magical transformation can handle complex data too. Let’s explore another scenario with a more intricate dataset.
Imagine you work for a transportation company that provides services across various cities. Your company collects data about each journey, including the starting city, destination city, distance traveled, and fare.
The Raw Data
| Journey ID | Start City | Destination City | Distance (km) | Fare ($) |
|---|---|---|---|---|
| 101 | New York | Boston | 345 | 50 |
| 102 | Boston | Washington, D.C. | 643 | 80 |
| 103 | Chicago | San Francisco | 2132 | 200 |
The Transformation
To analyze the travel patterns efficiently, you decide to convert the row-oriented data into a columnar format. You use the trusty “Transpose” feature again, and the data now looks like this:
| Journey ID | 101 | 102 | 103 |
|---|---|---|---|
| Start City | New York | Boston | Chicago |
| Destination City | Boston | Washington, D.C. | San Francisco |
| Distance (km) | 345 | 643 | 2132 |
| Fare ($) | 50 | 80 | 200 |
By changing rows to columns, you can easily analyze and compare journey details, simplifying data management for your transportation company.
Related Article: How To Remove Excel Add-in?
Conclusion
Excel’s “Transpose” feature turn rows into columns, making data management tasks easier. It works with various types of data, including ice cream sales, survey responses, and travel data. This feature also enhances the enjoyment of working with data.
Learn this trick to analyze complex data, find patterns, and discover hidden insights within inverted rows.
Related Article: How To Move Row in Excel?
Next time you see rows in a maze, use the “Transpose” feature like a magic wand to make it easier. Happy transforming!
Frequently Asked Questions
– It allows for easy data reorganization from row-oriented to columnar format.
– Simplifies data handling and manipulation.
– Enhances data visualization and analysis.
– Improves data presentation for reports and presentations.
Yes, you can select and convert multiple rows into columns simultaneously using the “Transpose” feature in Excel.
Learn more about Excel and Google Sheets hacks in other articles. Stay connected with us on social media and receive more daily tips and updates.
Speed up your spreadsheet tasks with Ajelix AI in Excel