20 KPI For Finance Department

KPI for finance department are clear, measurable numbers that show how well your business is performing financially. These metrics help you see if you’re hitting your goals and where you might need to make changes. Tracking the right KPIs gives you a real look at your company’s strengths and weaknesses, so you can make smarter decisions as you grow.
TL;DR
Financial KPIs for finance department give businesses a clear picture of their financial health, show how close they are to their goals, and highlight where things could be better. In this guide, I’ll cover over 20 essential KPIs across areas like profitability, liquidity, solvency, efficiency, growth, cost management, and investments. Your finance team can use these to make better decisions, improve cash flow, and build long-term stability. You’ll also get practical steps for building a KPI dashboard and a list of useful tools to make tracking and reporting much easier.
The finance department serves as the backbone of any successful business. It’s the nerve center responsible for the flow of funds, ensuring financial health, and driving strategic growth. Regular key performance indicators tracking provides a clear financial picture for the management reporting, and finance department.
This article will explore over 20 essential financial KPIs specifically tailored for the finance department. We’ll explore KPIs across profitability, liquidity, efficiency, growth, and more.
Change the way you work with agentic AI
One-click dashboards,KPI tracking, and AI-powered insights—for work that actually gets done.

List With Financial KPIs
- Gross profit margin
- Net profit margin
- Return on equity (ROE)
- Return on assets (ROA)
- Current ratio
- Quick ratio
- Debt-to-equity ratio
- Debt to Assets
- Inventory turnover
- Accounts receivable turnover
- Days Sales Outstanding (DSO)
- Days Payable Outstanding (DPO)
- Sales growth rate
- Customer acquisition cost (CAC)
- Customer Lifetime Value (CLV)
- Cost of goods sold (COGS) as a percentage of revenue
- Selling, general & administrative (SG&A) expenses as a percentage of revenue
- Return on investment (ROI)
- EBITDA: Earnings Before Interest, Taxes, Depreciation, and Amortization
- EBIT: Earnings before interest and taxes
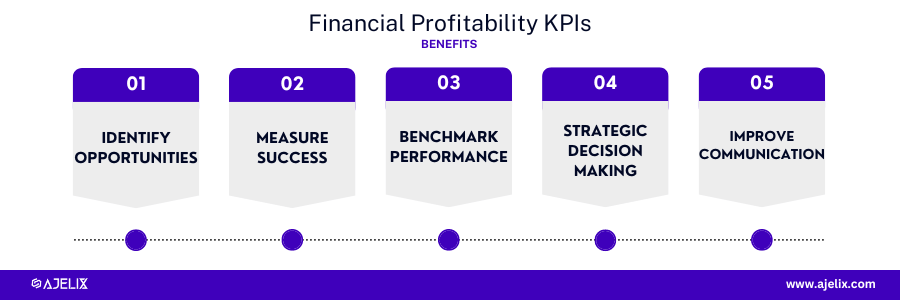
Financial Profitability KPIs: Are You Making Money?
You can’t just hope your business is profitable. You need to know. That’s where profitability KPIs come in. These aren’t just numbers for your CFO to stress over; they’re your reality check. Are you running an efficient business that generates real returns, or just moving money around?
Think of metrics like gross profit margin, net profit margin, return on equity (ROE), and return on assets (ROA) as your financial vital signs. Together, they tell you whether your company is healthy or if it’s time for some urgent care.
Here’s what tracking them looks like in practice:
- Stop guessing and start knowing. Profitability KPIs cut through the noise and show exactly how close you are to your profit targets. No more “I think we’re on track” you’ll see if your strategies are working.
- Find money hiding in plain sight. Dig into numbers, and you’ll spot where you’re bleeding cash, running inefficiently, or quietly crushing it. That might mean adjusting prices, shifting resources to a high-performing team, or finally investing in that new project.
- Get honest about where you stand. Compare your numbers with industry benchmarks or competitors (where you can), and you’ll quickly see where you’re ahead and where you’re playing catch-up.
- Make decisions with actual confidence. When you understand your true margins and ROI, choosing where to invest or how to price your product gets a whole lot easier. And if you want to test different scenarios before committing, a tool like Pigment can help you model the financial impact upfront, no guesswork required.
- Speak everyone’s language. Whether you’re updating the board, your investors, or your team, these KPIs give you a simple, powerful way to tell the story of your business’s health without the finance jargon.
1. Gross profit margin
This KPI measures the percentage of revenue left over after deducting the cost of goods sold (COGS). A higher gross profit margin indicates a company is more efficient at managing its production costs.
Gross Profit Margin Rate = (Gross Profit / Revenue) x 100%
You can calculate this metric using a gross profit margin calculator.
- Gross Profit: represents the profit a company makes after deducting the direct cost of producing the goods or services sold (Cost of Goods Sold or COGS).
- Revenue: the total income generated by the company from its sales activities.
Good Score:
A good gross profit margin rate can vary depending on the industry. However, a generally good range is between 60% and 70%.
2. Net profit margin
This KPI measures the percentage of revenue remaining after accounting for all expenses, including operating expenses, interest, and taxes. A higher net profit margin indicates a company is more effective at generating profits.
Net Profit Margin Rate = (Net Profit / Revenue) x 100%
You can calculate this metric using a net profit margin calculator.
- Net Profit: the company’s final profit after deducting all expenses from its revenue. This includes costs like production (COGS), operating expenses (rent, salaries, marketing), interest, and taxes. It reflects the overall profitability of the business.
- Revenue: the total income generated by the company from its sales activities.
Good Score:
A good net profit margin rate can vary depending on the industry. However, a generally healthy range is between 5% and 10%.
3. Return on equity (ROE)
This KPI measures the amount of net profit a company generates relative to shareholders’ equity. A higher ROE indicates a company is more effective at using shareholders’ money to generate profits.
ROE = (Net Profit / Shareholders’ Equity) x 100%
- Net Profit: the company’s final profit after deducting all expenses from its revenue. This reflects the overall profitability of the business.
- Shareholders’ Equity: the total value of the company’s equity that belongs to its shareholders. It’s calculated by subtracting total liabilities from total assets.
Good Score:
A good ROE rate can vary depending on the industry and a company’s growth stage. However, a generally good range is between 10% and 15%. Here’s a simplified guideline:
4. Return on assets (ROA)
This KPI measures the amount of net profit a company generates relative to its total assets. A higher ROA indicates a company is more effective at using its assets to generate profits.
ROA = (Net Profit / Total Assets) x 100%
You can calculate this metric using the return on assets calculator.
- Net Profit: This represents the company’s final profit after deducting all expenses from its revenue. This reflects the overall profitability of the business.
- Total Assets: This represents the total value of everything a company owns, including cash, inventory, property, equipment, and intangible assets like patents. It’s essentially a snapshot of everything the company has to work with.
Good Score:
A good ROA rate can vary depending on the industry and a company’s asset intensity (how heavily it relies on assets to generate revenue). However, a generally good range is between 5% and 10%.
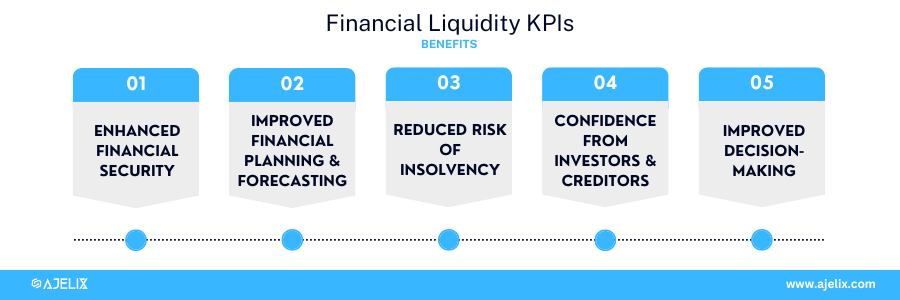
Financial Liquidity KPIs
The main goal of tracking financial liquidity KPIs is to keep cash flow healthy so your company can easily handle short-term obligations. Monitoring metrics like the current ratio and quick ratio helps the finance team see if there’s enough on hand to cover what you owe now, using what you already have.
Benefits of tracking financial liquidity:
- Enhanced financial security: Tracking liquidity KPIs helps you spot potential cash flow shortages early and take action before they become problems.
- Improved financial planning and forecasting: Reviewing historical liquidity data allows your finance team to build more accurate forecasts, making it easier to plan for future expenses and investments.
- Reduced risk of insolvency: Companies with strong liquidity are less likely to default on debts. Monitoring these KPIs helps finance teams catch risks early and take steps to avoid insolvency.
- Increased confidence from investors and creditors: Solid liquidity ratios show your business is stable and reliable. This builds trust with investors and lenders, often making it easier to secure funding on better terms.
- Better decision-making: Knowing your liquidity position gives you the information you need to allocate resources wisely, manage inventory efficiently, and make smart choices about taking on debt.
5. Current ratio
This KPI measures a company’s ability to pay its current liabilities (debts that are due within one year) with its current assets (assets that can be converted to cash within one year). A current ratio of greater than 1 indicates a company is likely to be able to meet its short-term obligations.
Current Ratio = Current Assets / Current Liabilities
- Current assets are items a company can turn into cash within a year. This includes cash on hand, accounts receivable, inventory, and marketable securities.
- Current liabilities are the bills and debts a company needs to pay within a year. This covers accounts payable to suppliers, short-term loans, and any expenses that have been incurred but not yet paid.
Good Score:
A strong current ratio shows that a company can cover its short-term debts with its current assets. What counts as a “good” ratio often depends on the industry, since some sectors need to hold more inventory or cash than others. It’s important to compare your ratio to similar businesses in your field rather than relying on a single benchmark.
| Current Ratio | Interpretation |
|---|---|
| Above 3.0 | Potentially excessive current assets, might indicate inefficiency |
| 1.5 to 3.0 | Generally, good range indicates the ability to meet short-term obligations |
| Below 1.0 | Warning sign, potential difficulty paying short-term debts |
6. Quick ratio
This KPI is similar to the current ratio, but it excludes inventory from current assets. This is because inventory is typically the least liquid asset. A quick ratio of greater than 1 indicates a company is highly liquid.
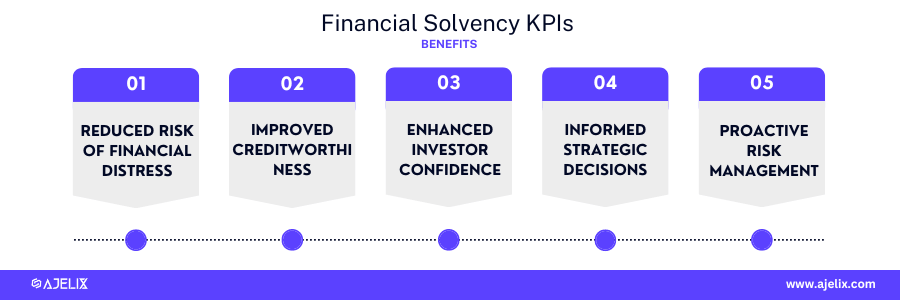
Financial Solvency KPIs
The main goal of tracking financial solvency KPIs is to ensure the company has the long-term financial strength to meet its debt obligations and remain operational for the foreseeable future.
Here’s how tracking these metrics can help you:
- Strong solvency ratios signal a lower risk of default to creditors. This can lead to better credit ratings, allowing the company to access loans and lines of credit at more favorable interest rates. Regular credit monitoring can further enhance this advantage by helping businesses track their financial health, detect potential risks early, and maintain a positive credit profile over time.
- Solvency ratios show lenders and partners that your business is low risk. It becomes simpler to get loans or credit on good terms. Checking your balance sheet and credit data regularly helps you catch any signs of trouble before they affect your credit rating.
- Investors naturally look for financial stability. If you maintain good solvency, you’ll give investors more confidence, making it easier to raise money when you need it for growth.
- Solid financial insight also means you can make better calls about how much debt to take, how to allocate your capital, and when it actually makes sense to distribute profits. It’s easier to weigh risks and spot the right opportunities.
- Long term, staying aware of these metrics helps you manage risk. You can fix small problems before they become real threats to your business’s stability.
7. Debt-to-equity ratio
This KPI shows how much debt a company has compared to its shareholders’ equity. A lower debt-to-equity ratio suggests the company is taking on less risk and has a stronger financial footing.
Debt-to-Equity Ratio = Total Liabilities / Shareholders’ Equity
- Total liabilities include everything a company owes to creditors, from short-term obligations like accounts payable to long-term debts.
- Shareholders’ equity is the portion of the company’s value that belongs to its shareholders. You get this number by subtracting total liabilities from total assets.
Good Score:
A good debt-to-equity ratio shows healthy financial leverage, meaning the company isn’t relying too much on borrowed money. Generally, a ratio below 2 is considered solid. If the ratio is higher than 2, it can signal the business is taking on more risk by using more debt to finance its operations. Lower ratios are usually viewed more favorably, since they suggest the company isn’t overly dependent on debt.
The ideal ratio can vary depending on the industry and the company’s growth stage.
8. Debt to Assets
The debt-to-asset ratio assesses a company’s financial health by indicating the proportion of its assets financed through debt.
Debt-to-Assets Ratio = Total Liabilities / Total Assets
Explanation of Variables:
- Total Liabilities: This represents all a company’s financial obligations that it owes to creditors. It includes short-term liabilities (like accounts payable) and long-term liabilities (like long-term debt).
- Total Assets: This represents the total value of everything a company owns, including cash, inventory, property, equipment, and intangible assets like patents. It’s essentially a snapshot of everything the company has to work with.
Good Score:
The ideal debt-to-equity ratio often depends on the industry and where the company is in its growth cycle. As a general rule:
- A ratio below 0.5 is generally seen as healthy. If the ratio climbs above 0.5, it may mean the company is starting to take on more risk by relying more on debt to finance its assets. At this level, it’s important to keep an eye on the ratio and make sure the company can handle its debt load.
- If the ratio goes much higher than 0.5, that’s a warning sign. The company could be depending too much on debt and may be more exposed to financial trouble if the market or economy takes a downturn.
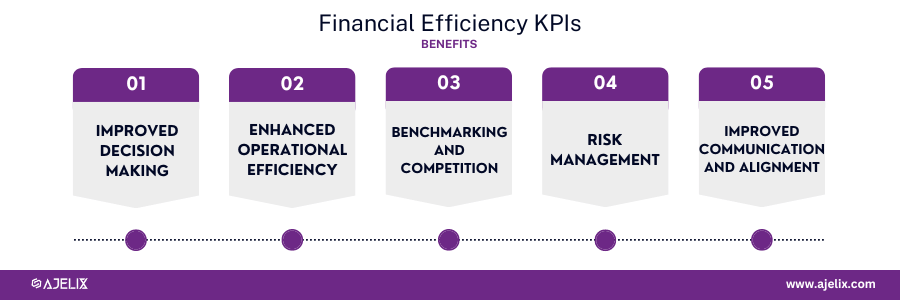
Financial Efficiency KPIs
Tracking financial efficiency KPIs is about making the most of your financial resources to boost profitability and ensure long-term stability. Keeping an eye on these key metrics and their trends helps you spot areas where you can do better. Some of the benefits include:
- Improved decision making: you get clear, data-driven insights into profitability, operational costs, and how resources are used, which helps you make better calls.
- Enhanced operational efficiency: these metrics uncover opportunities to streamline processes, improve inventory management, and allocate resources more effectively.
- Benchmarking and competitiveness: you see exactly how your company stacks up against competitors, making it easier to identify strengths and areas where you could do better.
- Risk management: monitoring these KPIs highlights potential cash flow issues and payment delays early. This lets you act before small issues become big problems.
- Better communication and alignment: KPIs give different teams common targets and help everyone stay on the same page, which leads to more focused collaboration toward your financial goals.
9. Inventory turnover
This KPI measures how many times a company sells and replaces its inventory over time. A higher inventory turnover ratio indicates a company is efficient at managing its inventory levels.
Inventory Turnover Rate = Cost of Goods Sold (COGS) / Average Inventory
- Cost of Goods Sold (COGS): the direct cost of producing the goods or services a company sells during a specific period. It reflects the cost of inventory used in the production process.
- Average Inventory: the average value of a company’s inventory throughout a specific period (often a year).
Good Score:
A strong inventory turnover rate shows the company is managing inventory well. Higher turnover usually means products are selling quickly and there isn’t a lot of excess stock sitting around. That’s a good sign for efficiency. Still, what counts as an ideal turnover rate can differ quite a bit depending on the industry.
10. Accounts receivable turnover
This KPI tracks how often a company collects payments from its customers within a set period. A higher accounts receivable turnover ratio means the company is collecting what it’s owed more efficiently.
Accounts Receivable Turnover Rate = Net Credit Sales / Average Accounts Receivable
- Net credit sales are the total revenue generated from sales made on credit during a specific period, excluding any returns, allowances, or cash sales.
- Average accounts receivable is the average amount customers owe the company from credit sales over a set time frame.
Good Score:
A strong accounts receivable turnover rate shows the company is collecting payments efficiently from customers who buy on credit. Higher turnover means receivables are coming in quickly and there’s less risk of bad debt. What qualifies as a good rate depends on the industry and the company’s approach to credit policies.
11. Days Sales Outstanding (DSO)
This KPI shows the average number of days it takes for a company to collect payment from customers after making a sale. A lower days sales outstanding (DSO) means the company is bringing in cash from receivables more efficiently.
DSO = (Average Accounts Receivable / Net Credit Sales) x Number of Days in Period
- Average Accounts Receivable: the average amount of money owed to a company by its customers on credit sales during a specific period.
- Net Credit Sales: represents the total revenue from credit sales during a specific period (often a year). It excludes any sales returns, allowances, or cash sales.
- Number of Days in Period: depends on the time frame you’re using to calculate DSO. It’s typically 365 days (for annual DSO) but could be adjusted to a quarter (90 days) or a month (30 days) depending on your analysis needs.
Good Score:
A good DSO rate indicates how long a company collects payment for its credit sales on average. A lower DSO is generally better, as it means the company collects its money faster and experiences less cash flow disruption.
12. Days Payable Outstanding (DPO)
This KPI measures the average number of days a company takes to pay its suppliers after receiving goods or services. A higher DPO can improve a company’s cash flow in the short term, but it can also damage relationships with suppliers.
DPO = (Average Accounts Payable / Cost of Goods Sold (COGS)) x Number of Days in Period
- Average Accounts Payable: This reflects the average amount a company owes to its suppliers for credit purchases during a specific period.
- Cost of Goods Sold (COGS): This represents the direct cost of producing the goods or services a company sells during a specific period.
- Number of Days in Period: This depends on the time frame you’re using to calculate DPO.
Good Score:
A good DPO rate indicates how long a company takes to pay its suppliers on average. A higher DPO, within reason, can be beneficial as it allows the company to hold onto cash for a longer period. However, there’s a balance to be struck, as excessively long payment terms could damage relationships with suppliers or lead to late payment penalties. The ideal DPO can vary depending on the industry and a company’s negotiation power with suppliers.
Efficient payment collection also depends on the reliability of your payment processing systems. Businesses in industries with higher chargeback risks, such as digital products or travel, often partner with a high-risk merchant service provider to ensure secure transaction processing and faster dispute resolution. Streamlined payments support healthier cash flow, reduce DSO, and improve KPI accuracy across finance reporting.
Financial Growth KPIs
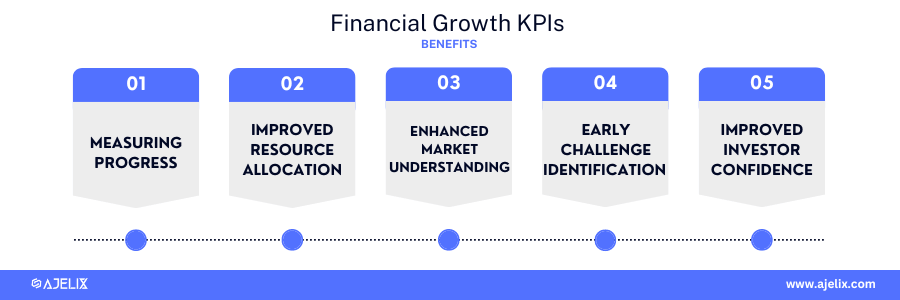
The main goal of tracking financial growth KPIs is to understand, measure, and optimize the key drivers of a company’s growth. By monitoring these metrics, businesses can ensure they are on track to achieve their strategic growth objectives. This can involve goals like:
- Measuring Progress towards Growth Goals: track your performance over time and identify areas where you might need to adjust strategies.
- Improved Resource Allocation: identify the most effective channels for customer acquisition, sales, and market expansion.
- Enhanced Market Understanding: understand your position in the market and identify potential growth opportunities.
- Early Identification of Challenges and Risks: Growth can sometimes come with challenges like increasing customer acquisition costs or diminishing returns on marketing investments. Tracking growth KPIs helps identify these potential issues early on.
- Improved Investor Confidence: Investors rely on financial growth KPIs to assess a company’s potential for future success. Strong and consistent growth metrics can improve investor confidence and attract additional funding to fuel further expansion.
13. Sales growth rate
This KPI measures the percentage change in a company’s sales from one period to the next. A positive sales growth rate indicates a company is growing its revenue.
Sales Growth Rate = ((Current Period Sales – Prior Period Sales) / Prior Period Sales) x 100%
- Current Period Sales: the total revenue generated by the company from its sales activities during the current period you’re analyzing (e.g., current year, quarter).
- Prior Period Sales: the total revenue generated by the company from its sales activities during the period you’re comparing to (e.g., previous year, quarter).
14. Customer acquisition cost (CAC)
This KPI measures the cost of acquiring a new customer. A lower CAC indicates a company is more efficient at marketing and sales.
CAC Rate = (Total Customer Acquisition Costs / Number of New Customers Acquired)
- Total Customer Acquisition Costs: the total expenses a company incurs to acquire a new customer. It includes marketing and sales expenses like advertising costs, salaries for sales representatives, content marketing efforts, and affiliate marketing fees.
- Number of New Customers Acquired: the total number of new customers a company gains within a specific period (often a month, quarter, or year).
Good score:
Ideally, your CAC should be significantly lower than your CLTV (customer lifetime value), which represents the total revenue a customer generates for your business over their relationship.
15. Customer Lifetime Value (CLV)
This KPI measures the total revenue a company can expect to generate from a customer over their relationship with the company. A higher CLV indicates that a company is acquiring profitable customers.
CLTV = Average Revenue per Customer x Average Customer Lifespan
- Average Revenue per Customer: the average amount of revenue a customer generates for the business over a specific period. It can be calculated by dividing the total revenue by the number of customers within that period.
- Average Customer Lifespan: the average duration a customer remains a paying customer of the business. It can be estimated using historical data on customer churn (customer loss).
Good score:
Your CLTV should ideally be several times higher than your Customer Acquisition Cost (CAC). This ensures you’re making a profit on customer acquisition.
Financial Cost Management KPIs
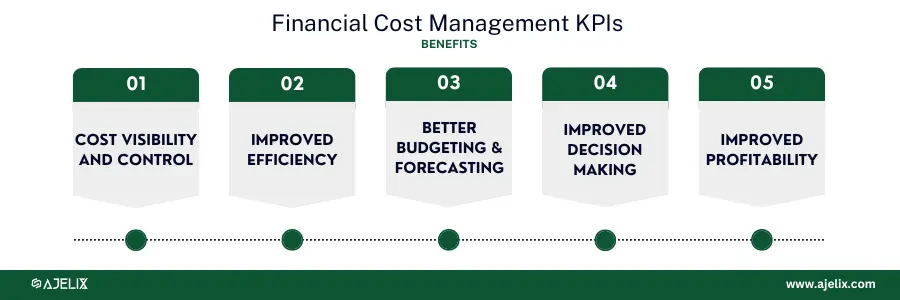
The main goal of tracking financial cost management KPIs is to optimize your spending, minimize unnecessary expenses, and maximize the value you get from every euro invested. This translates to improved profitability and a more financially sustainable business model. By monitoring these metrics, companies can:
- Cost Visibility and Control: gain insights and a clear picture of your spending patterns and identify potential areas for cost reduction.
- Improved Efficiency: reveal inefficiencies in processes, resource allocation, or inventory management.
- Enhanced Budgeting and Forecasting: predict future expenses with greater confidence and allocate resources more effectively.
- Better Decision Making: make informed decisions regarding pricing strategies, vendor negotiations, and resource allocation.
- Improved Profitability: increase profit margins and ensure you’re getting the most value out of your spending, ultimately leading to a healthier bottom line.
16. Cost of goods sold (COGS) as a percentage of revenue
This KPI measures the percentage of revenue that a company spends on producing its goods or services. A lower COGS percentage of revenue indicates a company is efficient at managing its production costs.
COGS Percentage of Revenue = (COGS / Revenue) x 100%
- COGS (Cost of Goods Sold): the direct cost of producing the goods or services a company sells during a specific period. It reflects the cost of inventory used in the production process. This includes the cost of raw materials, labor directly involved in production, and any other directly attributable expenses.
- Revenue: the total income generated by the company from its sales activities during a specific period.
Good score:
A lower COGS percentage of revenue indicates a higher gross margin (revenue minus COGS), which signifies better profitability from core business activities.
17. Selling, general & administrative (SG&A) expenses as a percentage of revenue
This KPI measures the percentage of revenue that a company spends on selling, general, and administrative expenses. A lower SG&A percentage of revenue indicates a company is efficient at managing its overhead costs.
SG&A Expense Percentage of Revenue = (SG&A Expenses / Revenue) x 100%
- SG&A Expenses: These represent all the indirect operating expenses a company incurs that are not directly related to the production of goods or services. Examples include:
- Marketing and advertising costs
- Sales commissions
- Salaries for administrative staff
- Rent and utilities for office space
- Depreciation and amortization expenses
- Revenue: This represents the total income generated by the company from its sales activities during a specific period.
Generally good range: 15% to 35% This range is a starting point, and the ideal percentage can vary significantly.
Financial Investment KPIs
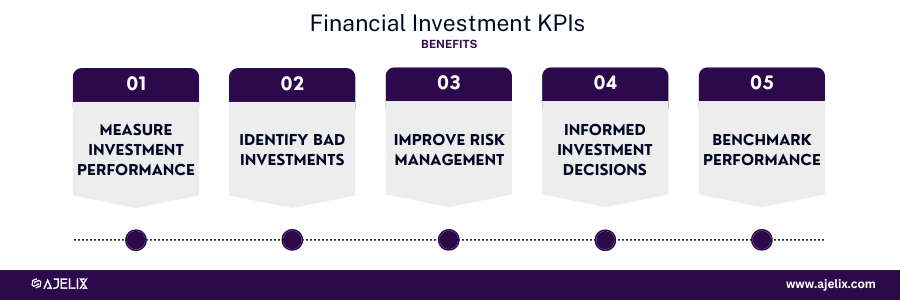
The main goal of tracking financial investment KPIs is to maximize the return on your investments while managing risk effectively. By monitoring these metrics, you gain these benefits:
- Measure Investment Performance: quantify the returns generated by your investments and compare the performance of different investments to assess whether they are meeting your expectations.
- Identify Underperforming Investments: reveal investments that are not generating the desired returns.
- Improved Risk Management: ensure your portfolio is balanced and not taking on excessive risk for the potential return.
- Informed Investment Decisions: allocate resources strategically towards opportunities with higher potential returns and align your portfolio with your overall financial goals.
- Benchmarking Performance: understand how your portfolio is performing relative to others. This can help identify areas for improvement and potentially exceed market averages.
18. Return on investment (ROI)
This KPI measures the amount of return on investment that a company generates from its investments. A higher ROI indicates that a company’s investments are performing well.
ROI = (Net Profit / Investment) x 100%
- Net Profit: the company’s profit after accounting for all expenses and taxes during a specific period (often a year).
- Investment: the cost incurred by the company for the investment being evaluated. It could be the initial cost of a project, a new marketing campaign, or any resource allocation you’re measuring the return on.
Good score:
A positive ROI is ideal indicating that the investment generated a return that exceeded the initial cost. A higher ROI is generally better it signifies a more profitable investment.
19. EBITDA: Earnings Before Interest, Taxes, Depreciation, and Amortization
This KPI is a measure of a company’s profitability before accounting for financing decisions and accounting charges. EBITDA is often used to compare the profitability of companies in different industries.
EBITDA Rate = EBITDA / Revenue x 100%
- EBITDA: a company’s profitability from its core operations, excluding the impact of financing choices, tax structures, and accounting decisions related to depreciation and amortization.
- Revenue: the total income generated by the company from its sales activities during a specific period (often a year).
Higher is generally better a higher EBITDA rate indicates a company is generating more profit from its core operations relative to its revenue.
20. EBIT: Earnings before interest and taxes
A financial metric that shows a company’s profitability from its core operations, excluding the effects of financing decisions and taxes.
EBIT Rate = EBIT / Revenue x 100%
- EBIT: company’s profitability from its core operations, after accounting for operating expenses but before considering the impact of financing choices (interest) and tax structures.
- Revenue: the total income generated by the company from its sales activities during a specific period (often a year).
A higher ratio is generally a better EBIT rate indicates a company is generating more profit from its core business activities relative to its revenue, after accounting for operational costs.
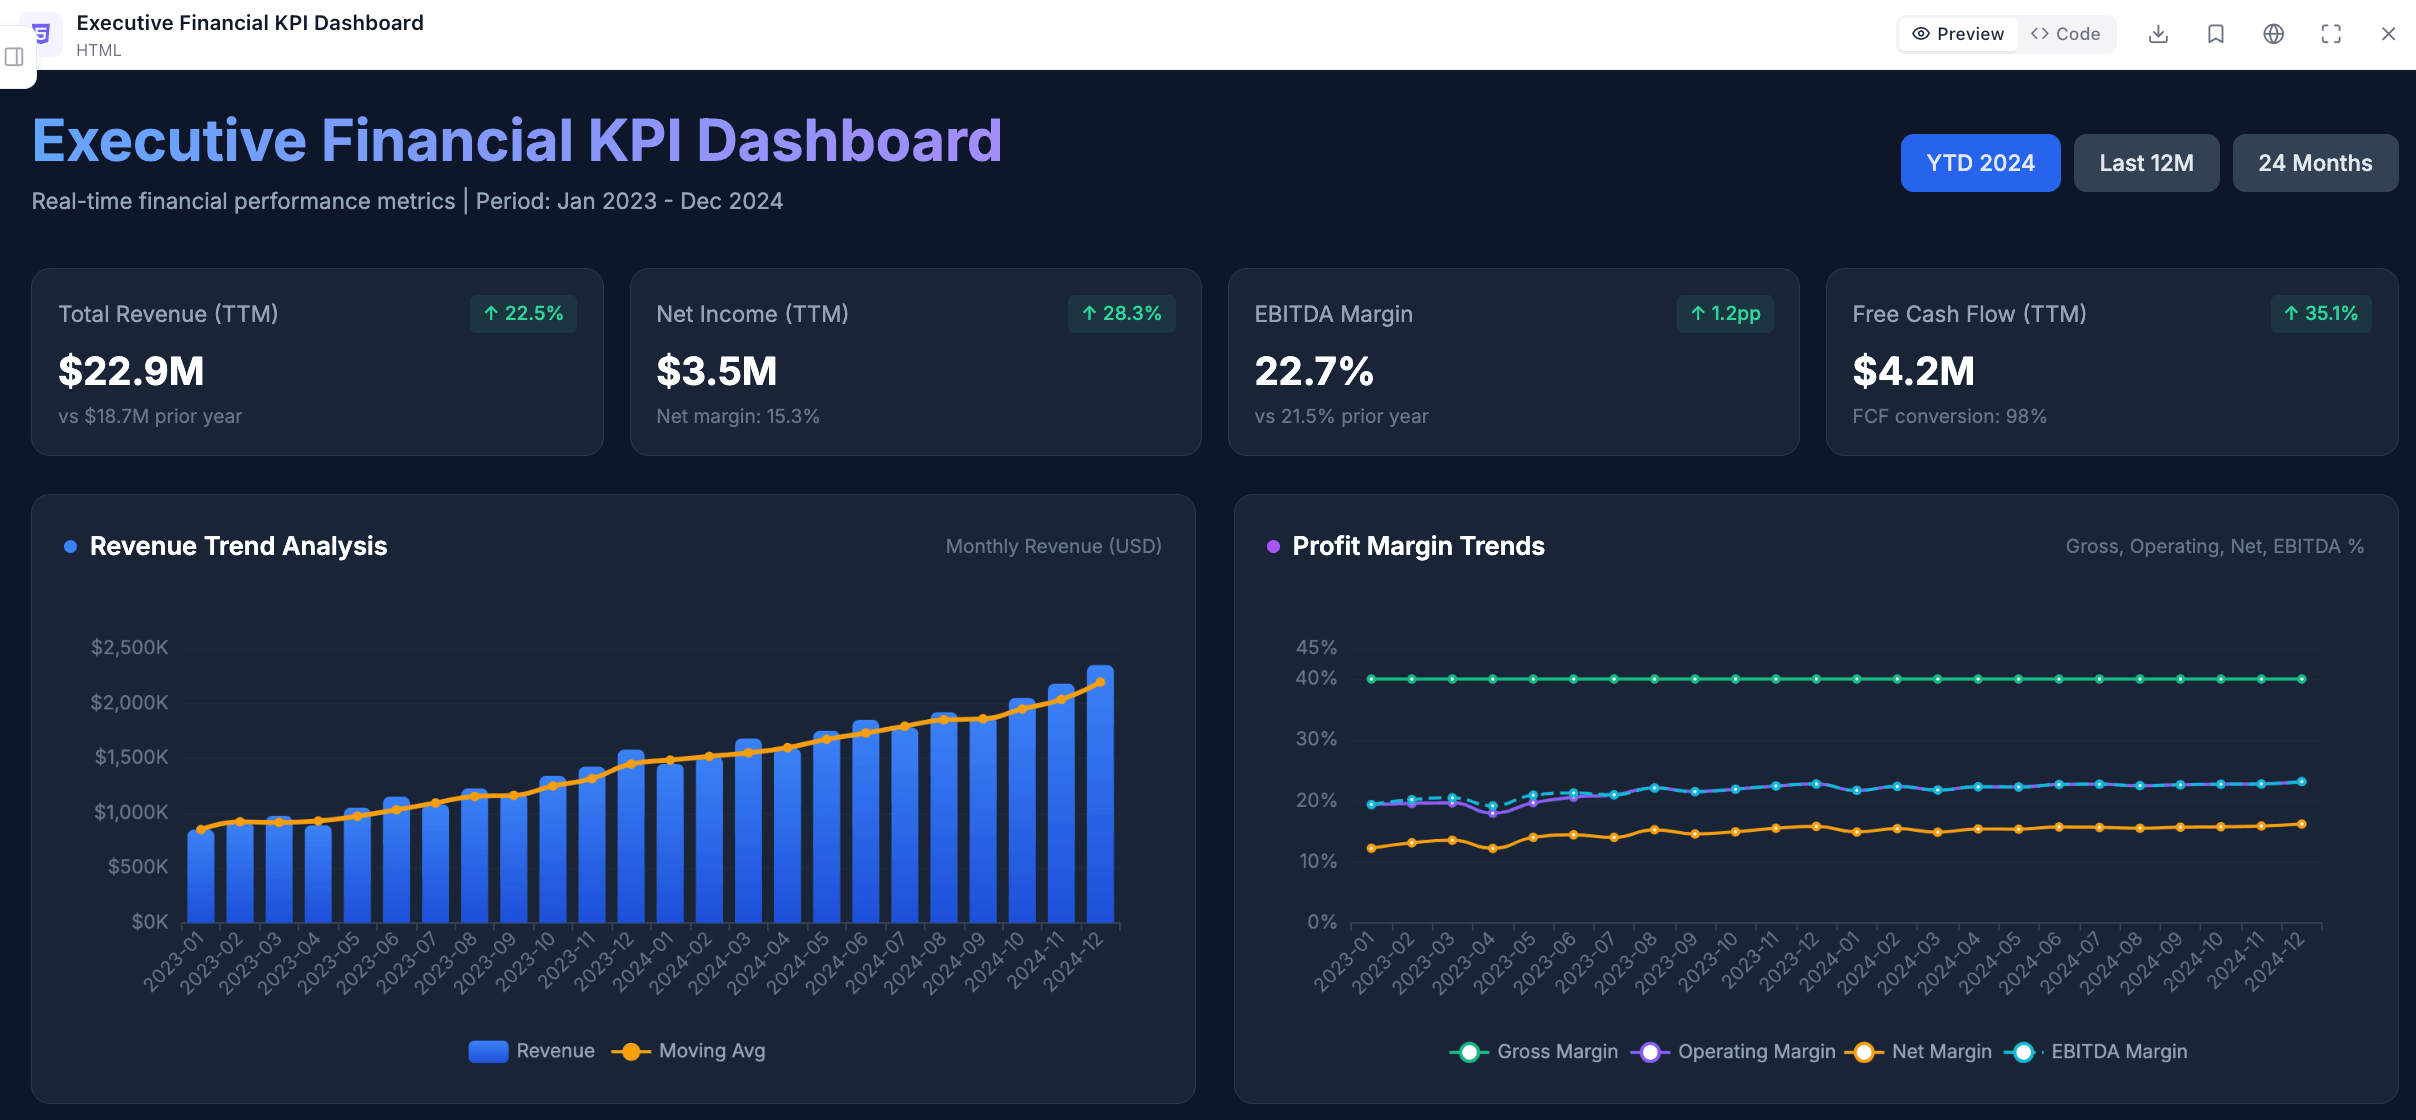
How To Create a Financial KPI Dashboard?
This guide will show you how to create a KPI (Key Performance Indicator) dashboard using the Ajelix AI agent. While the exact steps might differ slightly depending on the specific software, the overall process remains consistent.
- Add a prompt and Upload your data
Upload your files or connect your Google Sheets within the chat.ajelix.com interface. Write a prompt, for example: Create an executive financial KPI dashboard showing revenue trends, profit margins, cash flow analysis, key financial ratios, and budget variance over time with interactive charts and monthly period comparisons.
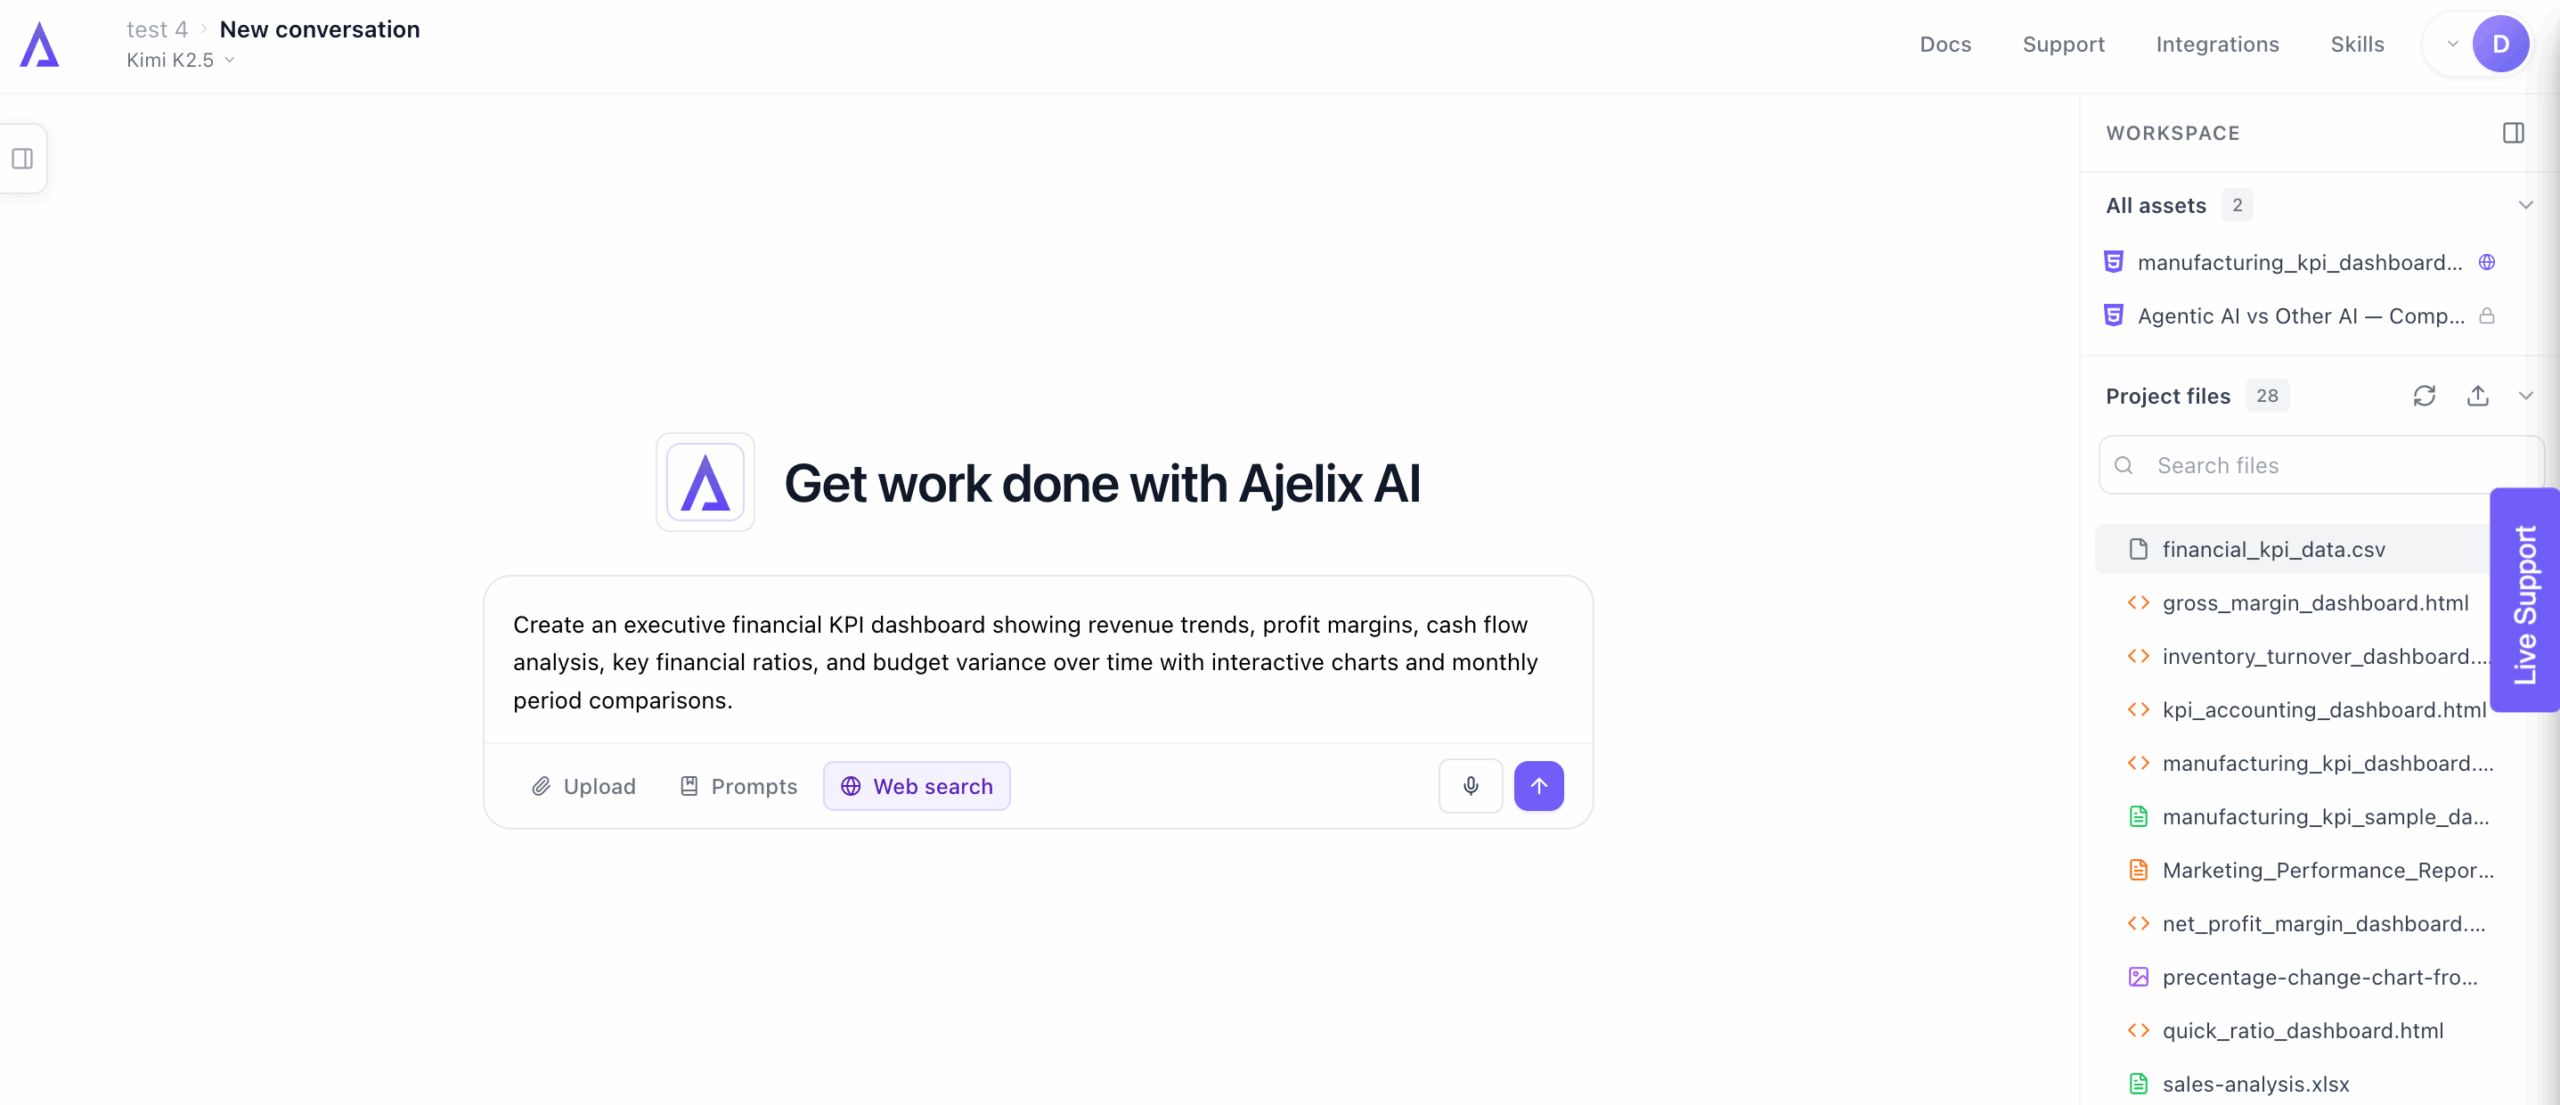
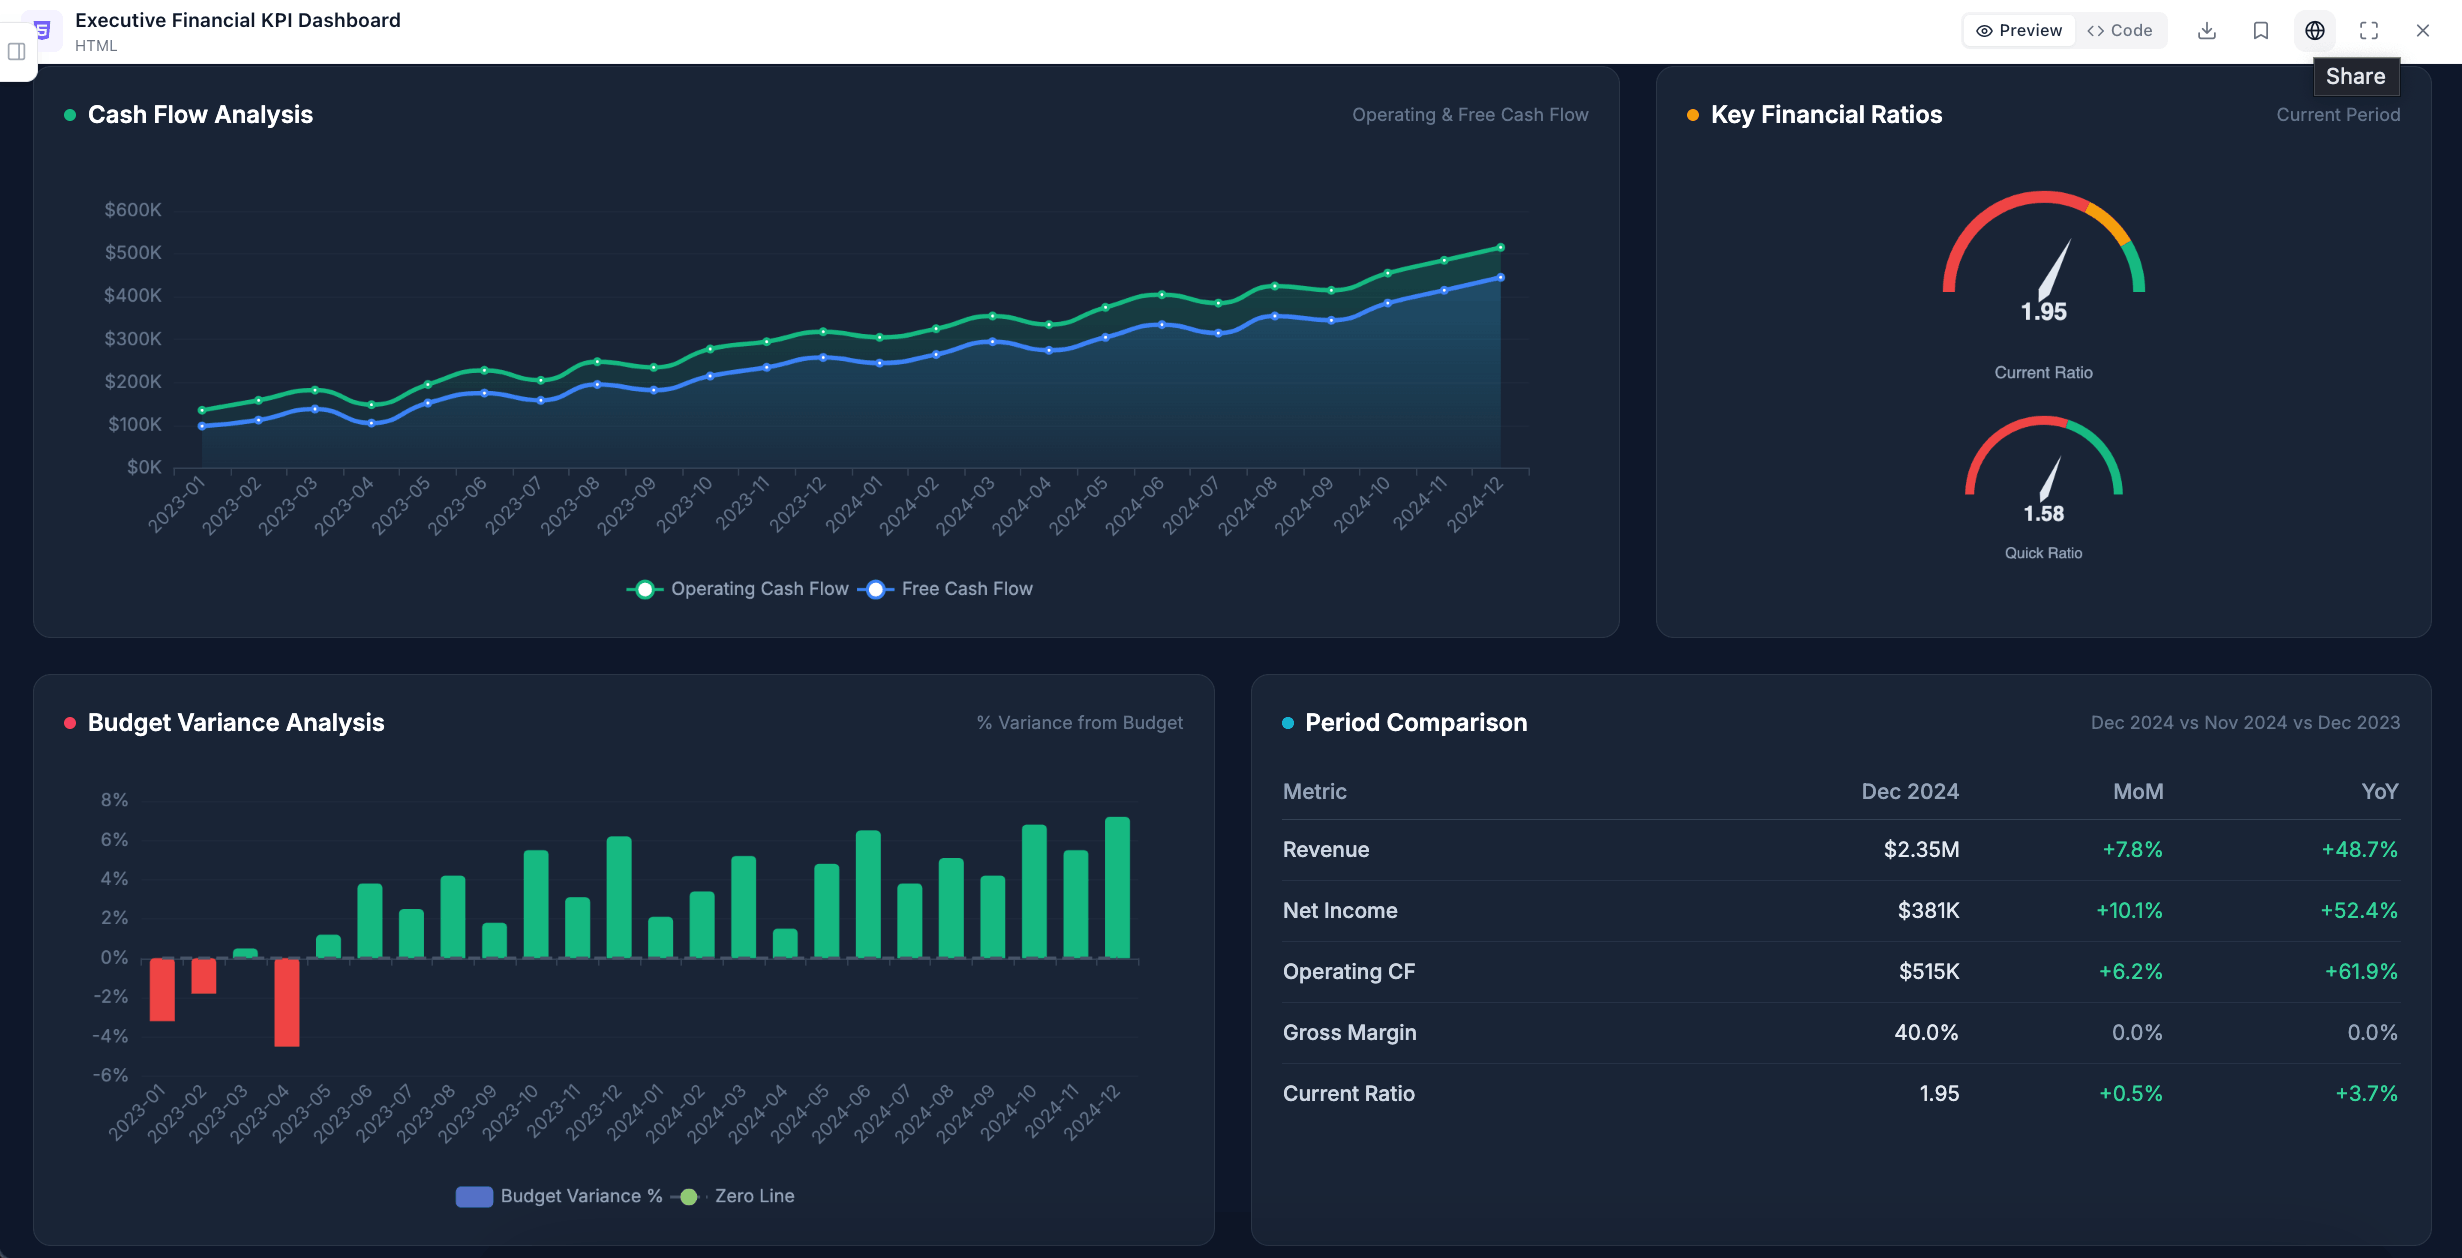
- Ajelix will build your visualizations
You can send follow-up prompts about anything you would like changing.
- Share your dashboard
Once happy, publish your dashboard and share it with relevant users for real-time insights.
Reporting gives you a headache?
Upload your data and create professional reports with agentic AI

Start free
Try free and upgrade whenever
Tools For Tracking Financial KPIs
Several tools can be used for tracking KPI for finance department. Here are a few of the most popular:
- Spreadsheets: simple and free, but can be time-consuming to maintain.
- Financial accounting software: may already offer KPI tracking features for existing users.
- AI agents like Ajelix: many offer a free trial.
FAQ
The frequency of tracking financial KPIs depends on the specific metric. Operational metrics should be tracked daily or weekly, however, most financial KPIs are tracked monthly and overall financial health indicators are tracked quarterly or annually.
Both measure a company’s ability to pay short-term debts (within a year). The current Ratio uses all current assets (including inventory, which can take time to sell) but the quick ratio uses only the most liquid assets (cash, and receivables that can be collected quickly).
The responsibility for tracking KPIs can be shared but often falls to the finance department as they have the data and expertise to analyze financial metrics.
From data to report in one minute or less with Ajelix AI Agents


