How To Forecast Cash Flow In Excel (Step by Step Guide 2026)

How to forecast cash flow in Excel to stay on top of your business’s finances? It isn’t that difficult, and in this article, we will show you exactly how to do it.
Forecasting cash flow in Excel helps you estimate future cash inflows and outflows over a set period, helping you anticipate shortages, plan investments, and make data-driven decisions. Whether you’re a small business owner or a financial analyst, creating a cash flow forecast in Excel is essential for your financial planning.
What is Cash Flow Forecasting?
Cash flow forecasting is the process of estimating a business’s incoming and outgoing cash over a specific period. It’s a vital financial tool that helps businesses anticipate future cash needs, spot potential shortfalls in advance, and plan proactively for various scenarios.
By forecasting cash flow, companies can make more informed decisions and maintain financial stability.
Benefits for Businesses
Why is cash flow forecasting important for businesses?
Cash flow forecasting is essential for businesses because it helps them manage their cash flow projections effectively. By forecasting, businesses can ensure they have enough cash to cover expenses, meet financial obligations, and invest in growth opportunities.
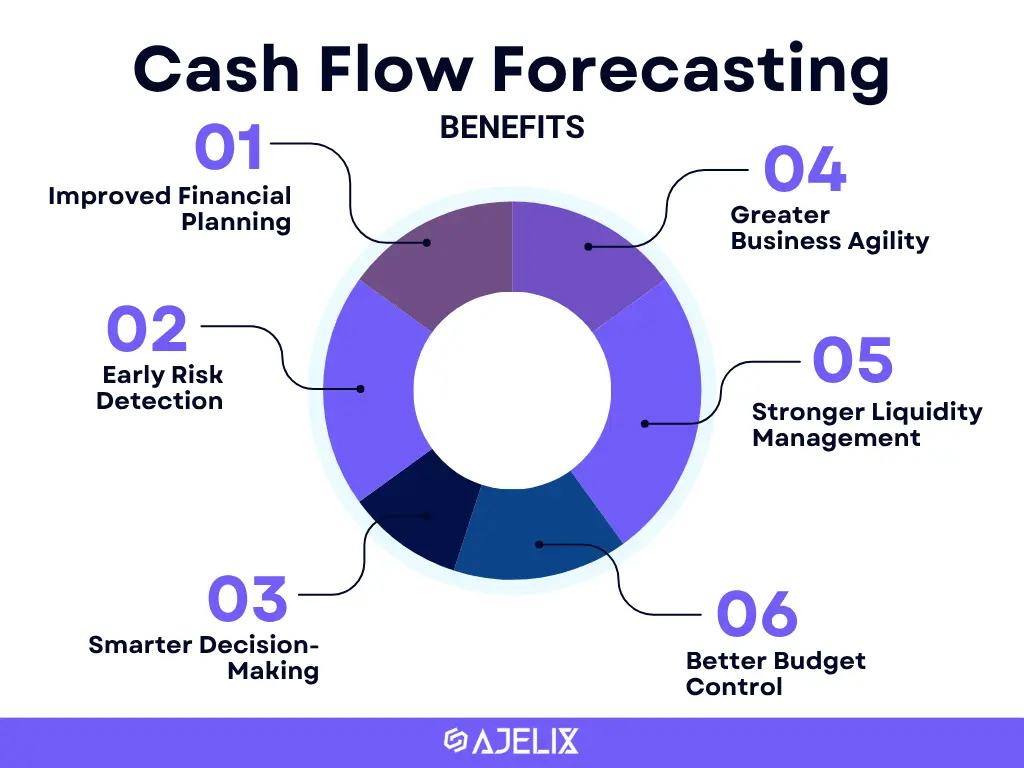
Let’s look at each benefit more closely:
- Improved Financial Planning: Forecasts help align cash availability with upcoming expenses and goals.
- Early Risk Detection: Identifies potential cash shortages before they become critical.
- Smarter Decision-Making: Informs better choices with clear visibility into future cash flow.
- Better Budget Control: Compares forecasts with actuals to keep spending on track.
- Stronger Liquidity Management: Ensures cash is available to cover short-term obligations.
- Greater Business Agility: Enables faster response to market and financial changes.
Cash Flow Forecasting Methods
There are two main methods for cash flow forecasting: the direct method and the indirect method.
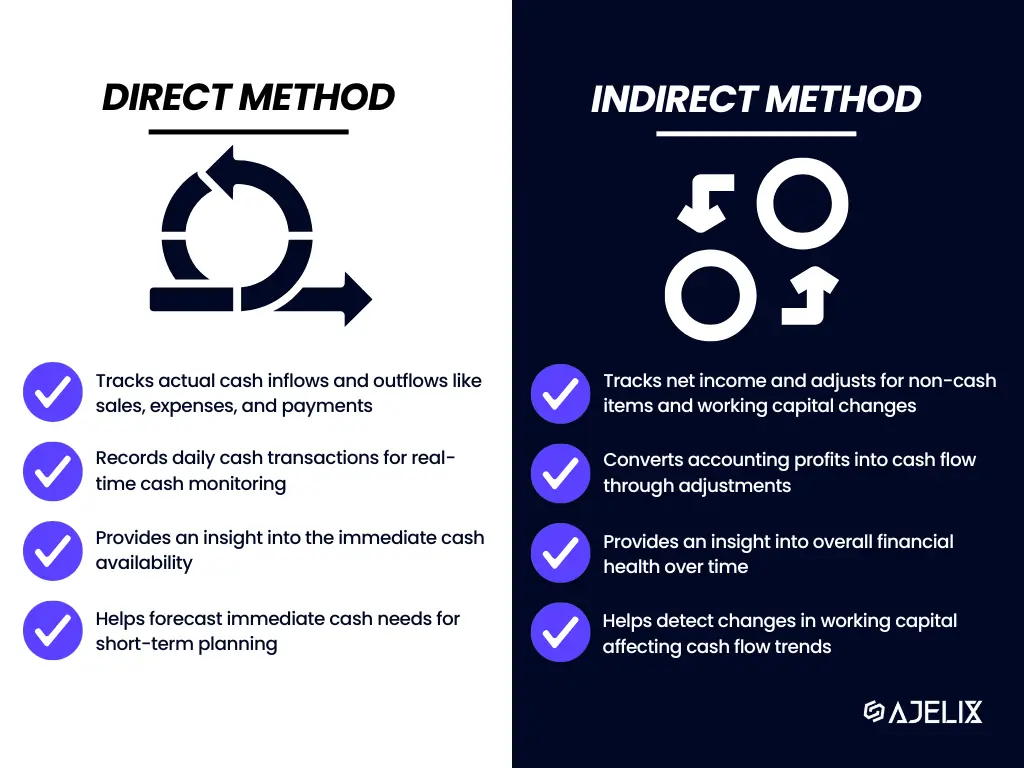
The direct method uses actual or expected cash inflows and outflows, like customer payments, salaries, and rent, to project short-term liquidity with high accuracy. In contrast, the indirect method starts with net income and adjusts for non-cash items and changes in working capital, making it better suited for long-term planning and financial reporting.
Both methods have their strengths, and the choice depends on your business needs and the time horizon you’re forecasting for.
How To Create a Cash Flow Forecast in Excel?
Let’s cut the fluff and dive into the practical how-to of creating a basic cash flow forecast in Excel. It involves inputting cash inflows and outflows, forecasting cash flow data for a specific period, and then calculating the net flow. Quite simple.
Here are the 5 straightforward steps on creating a cash flow forecast in Excel:
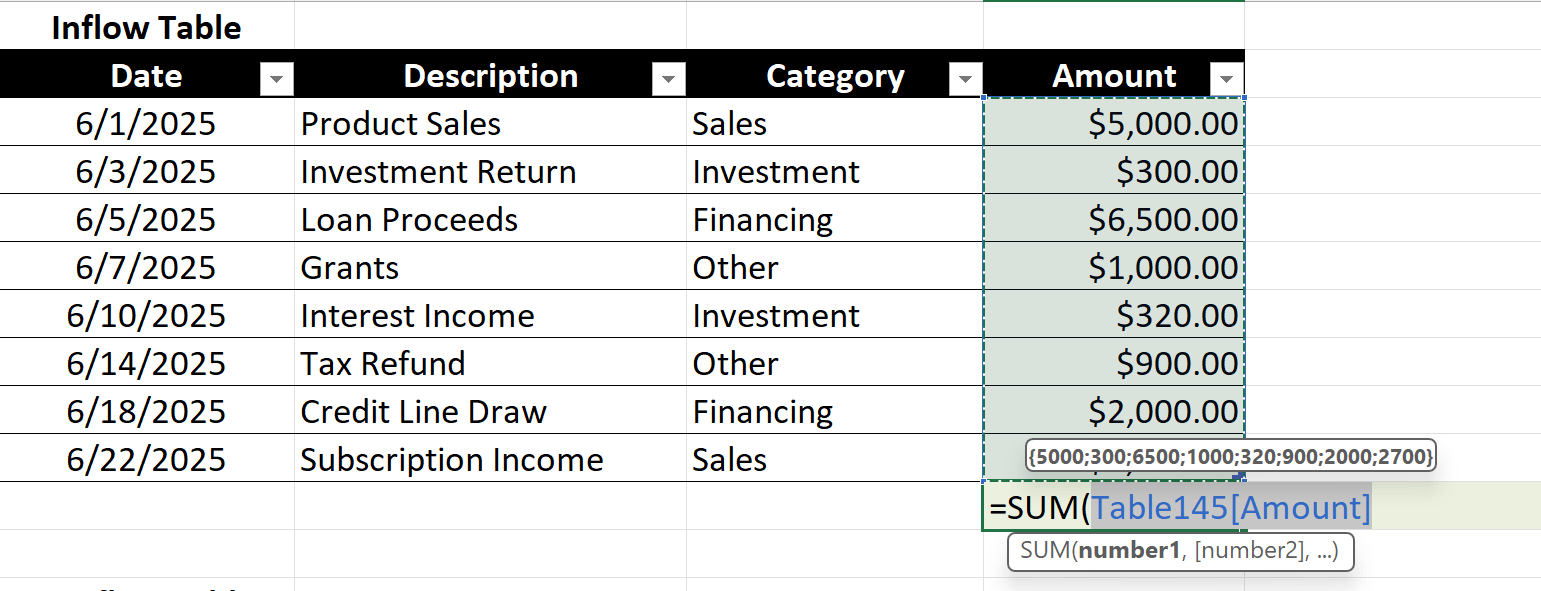
- Input cash inflow data
Make a table for inflow data. Enter all sources of incoming cash, such as sales revenue, investment income, loan proceeds, grants, and other income streams. Calculate total cash inflow with SUM formula.
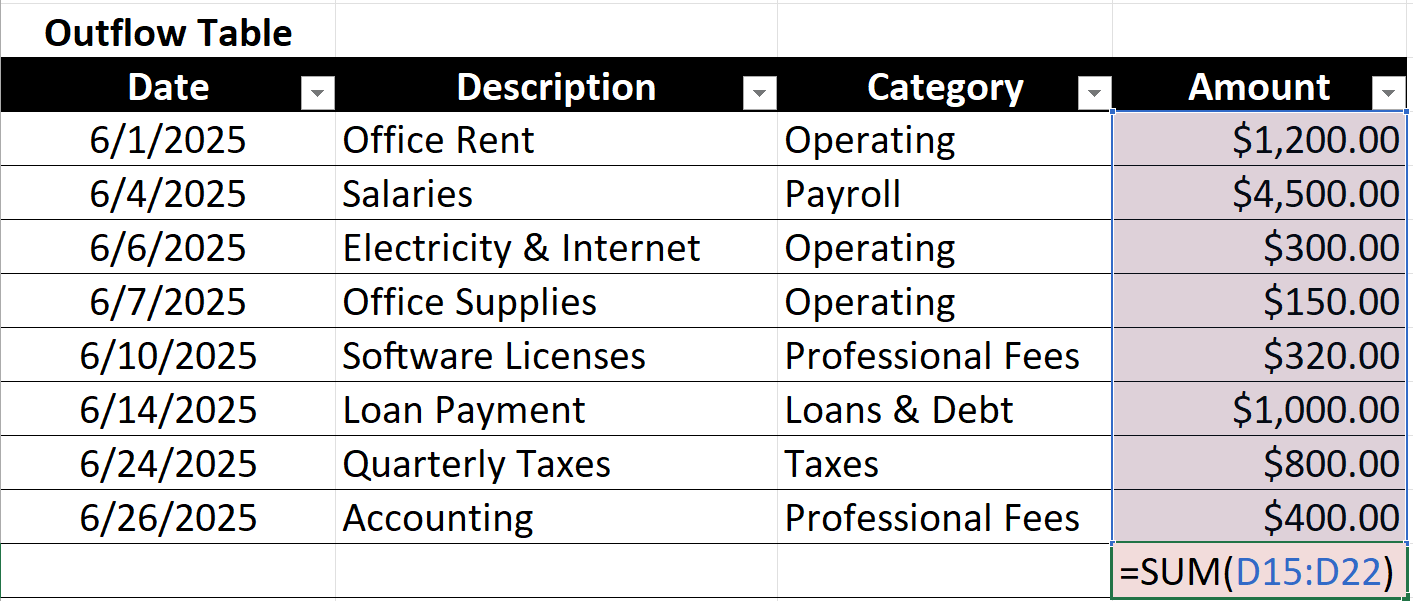
- Input cash outflow data
Make a table for outflow data. Add expenses like operating costs, capital expenditures, loan payments, payroll, and taxes. Calculate total cash outflow with SUM formula.
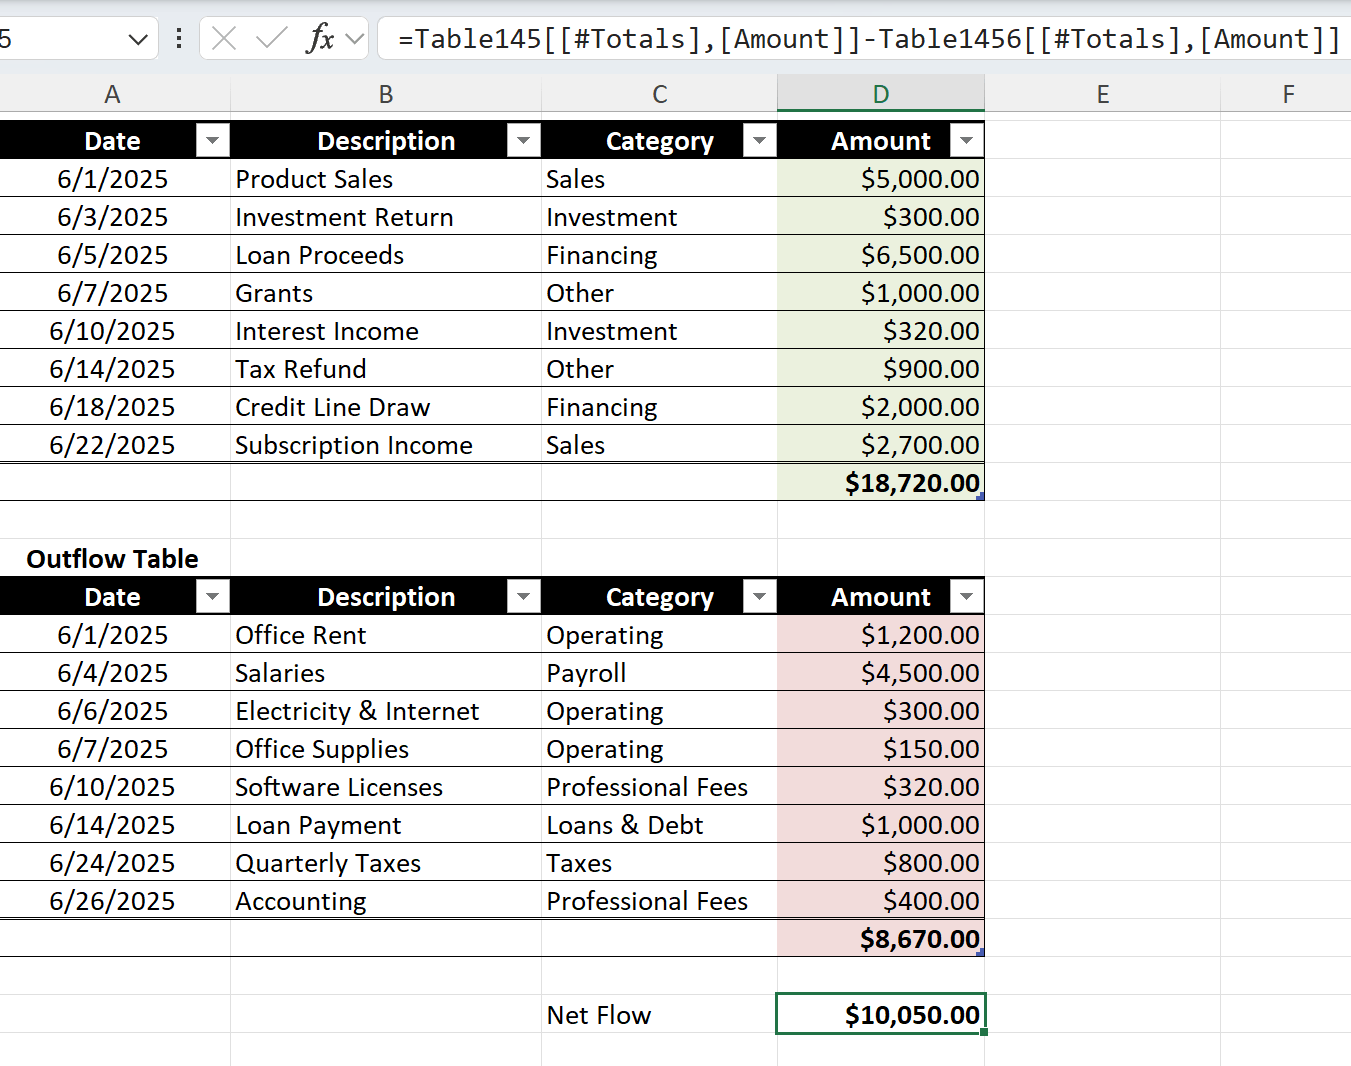
- Calculate net cash flow
Subtract total outflows from total inflows to determine your net cash flow for the period. =SUM(total inflow) – SUM(total outflow)
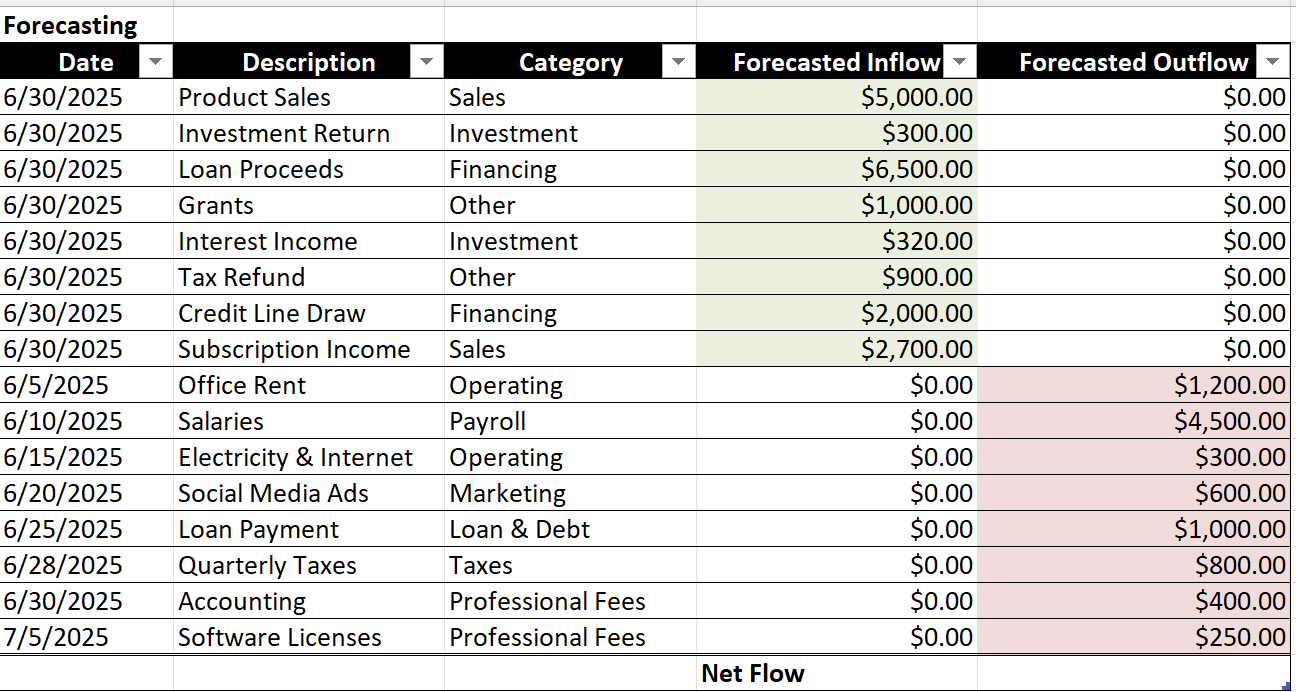
- Forecast cash inflow & outflow data
You can make separate tables for inflow and outflow again, or put all data in one cash flow forecast projection table. Estimate future cash inflows and outflows based on trends, planned activities, or known upcoming transactions. Add them to your forecasting table.
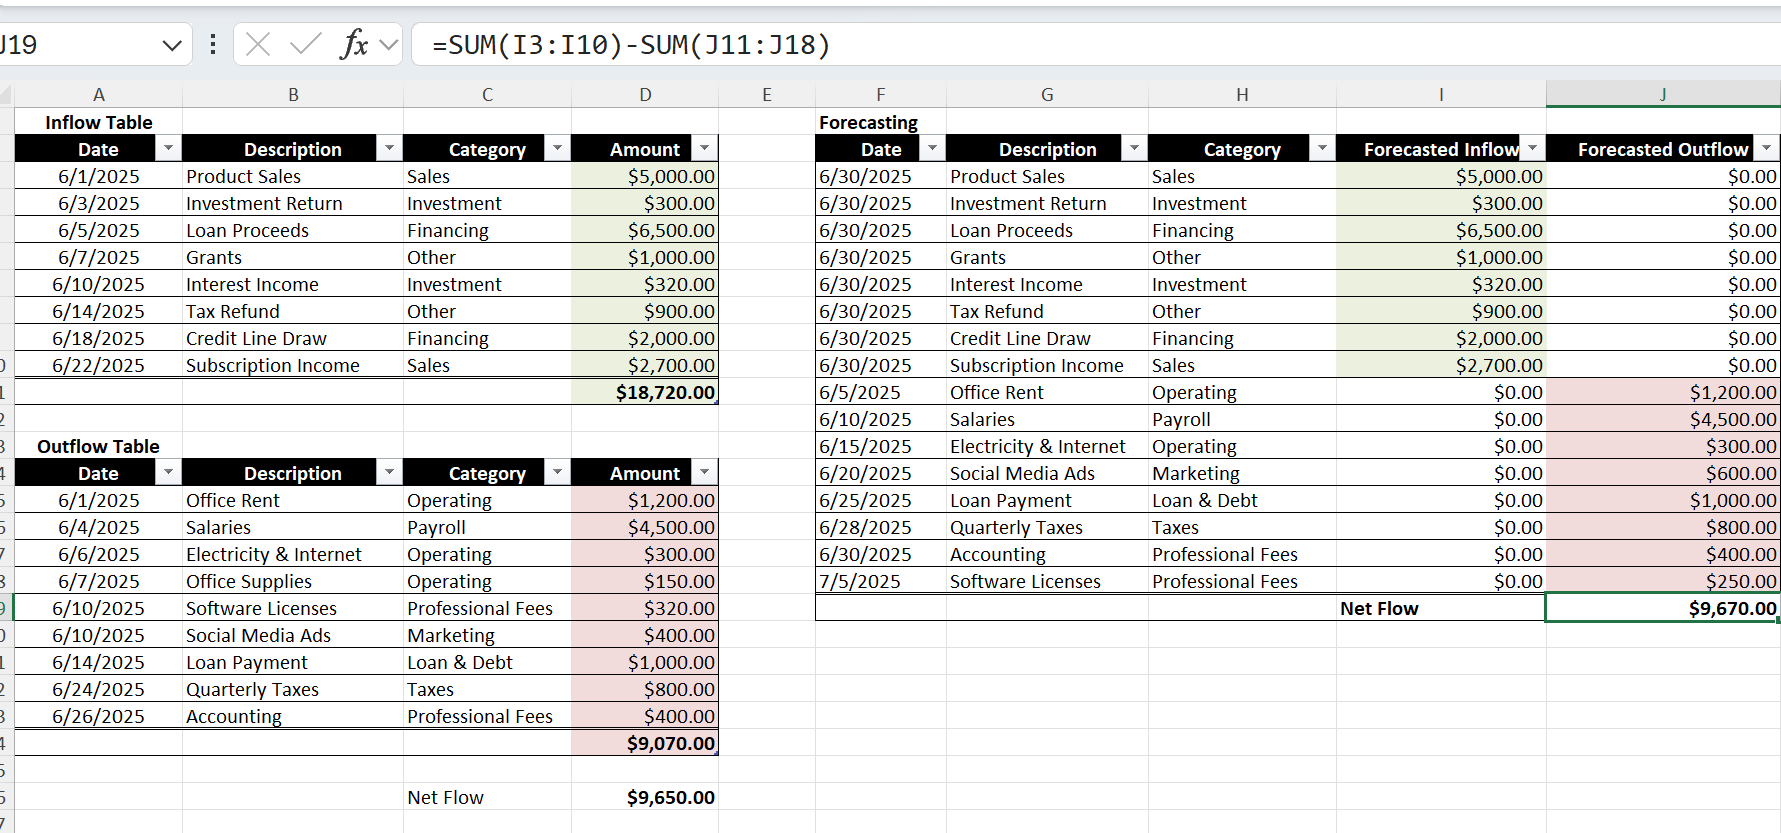
- Calculate forecast net cash flow
Subtract forecasted total outflows from forecasted total inflows to find the projected net cash flow for the upcoming period. =SUM(total inflow) – SUM(total outflow)
What Excel Functions Are Used For Cash Flow Forecasting?
Excel is a powerful tool that can simplify accurate cash flow forecast projections. We showed you a basic cash flow forecast, but Excel also offers built-in forecasting functions that make it easier to perform more complex calculations. The functions include the previously used SUM and others, like IF, NPV, and IRR, which make complex calculations more efficient.
SUM Function for Cash Inflow and Outflow
The SUM function is used to add up a range of numbers in Excel, and it is the basis of your cash flow forecasting. This is the function we used in the how-to guide to calculate the total accurate cash inflows and outflows for the given period. By inputting the appropriate data into Excel, the SUM function can be used to quickly calculate the net cash flow and the net cash flow forecast.
IF Function to Forecast Changes
The IF function in Excel is used to perform calculations based on a specific condition. This function is particularly useful for forecasting changes in cash position based on changes in other variables. For example, you could use the IF function to calculate how an increase in sales revenue will impact your finances.
You might find this useful: How To Use IF Function in Excel?
NPV function for Cash Flow Analysis
The NPV (Net Present Value) function in Excel is used to calculate the present value of future cash flows. This function is particularly useful for businesses that need to evaluate the profitability of a particular investment. By calculating the NPV of an investment, you can determine whether it will generate a positive or negative return.
You might find this useful: Free NPV Calculator
IRR Function to Calculate the Rate of Return
The IRR (Internal Rate of Return) function in Excel is used to calculate the rate of return on investment. This function is particularly useful for businesses that need to evaluate the profitability of a particular investment. By calculating the IRR of an investment, you can determine whether it will generate a positive or negative return.
In case you are eager to learn more about cash flow forecast Excel formulas and need some guidance, feel free to check our Excel formula and function library.
How To Analyze Cash Flow Forecast Data?
There are five effective ways to analyze your cash flow forecast data.
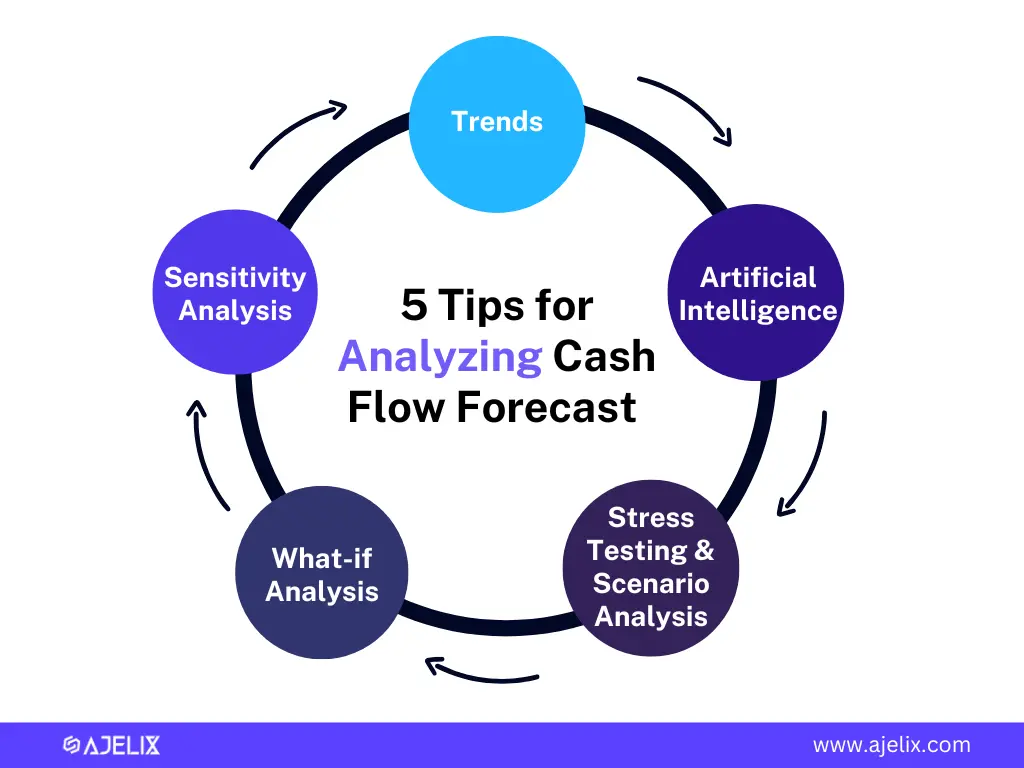
1. Forecasting Based on Trends
Analyzing past cash flow patterns helps businesses identify trends that can be used to forecast future cash flows. By understanding how money has moved in and out over time, businesses can make more informed predictions and improve the accuracy of their financial planning. This supports smarter decisions around budgeting, investments, and overall financial health.
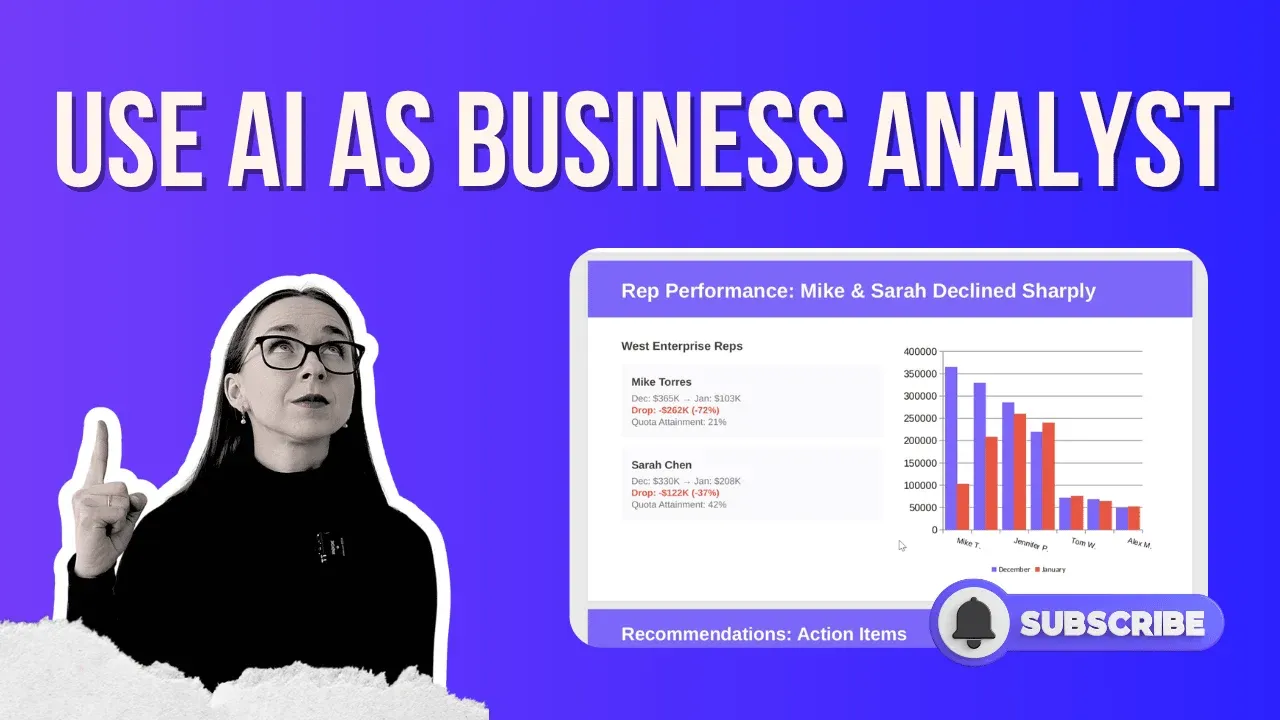
2. Using AI to Forecast Cash Flow
If all this forecasting and analysis sounds time-consuming (and let’s be honest, it often is), consider turning to AI for help. Artificial intelligence can greatly improve cash flow forecasting by automating data analysis, identifying trends, and generating accurate financial projections.
At Ajelix, we offer over 18 AI-powered tools, including 10 specifically designed for Excel, built to boost productivity and automate your spreadsheet tasks.
Take our AI Data Analyst, for example. It’s like ChatGPT, but tailored for advanced data work. Whether you need to forecast cash flow, clean up messy data, or extract key insights, just ask, and it gets work done in seconds. Check it in action:
3. Stress Testing and Scenario Analysis
Scenario analysis involves analyzing the impact of various scenarios on future cash flows, such as economic recession or major natural disaster. Businesses can use scenario analysis to evaluate the impact of changes in:
- interest rates
- exchange rates
- sales volumes on cash flow
4. What-if Analysis in Excel
What-if analysis involves analyzing the impact of hypothetical changes on cash flow. For example, businesses can use what-if analysis to evaluate the impact of a major investment activity or a change in the business model on cash flow from investing.
5. Sensitivity Analysis
Sensitivity analysis involves analyzing the impact of changes in one variable on cash flow. For example, businesses can use sensitivity analysis. To evaluate the impact of changes in interest rates or exchange rates on cash flow.
Conclusion
Now that you’ve learned how to forecast cash flow in Excel, you’re better equipped to manage your business’s finances with confidence. Whether it’s anticipating shortfalls, planning investments, or simply gaining more visibility into your financial health, creating a cash flow forecast in Excel is a valuable skill.
With the right structure and tools, your cash flow forecast Excel model can become a powerful part of your financial planning toolkit. Consider using AI tools to automate this process and save time, reduce errors, and generate more accurate financial insights.
Eager to learn more about Excel and AI? Check our other articles and stay connected with us on socials.
FAQ
A cash flow forecast in Excel is a financial tool used to estimate future cash inflows and outflows over a specific period. It helps businesses plan for upcoming expenses, investments, and potential cash shortages using structured data tables and formulas.
Creating a cash flow forecast in Excel is essential for managing business finances. It enables you to predict shortfalls, plan for investments, and make well-informed financial decisions by providing visibility into your future cash situation.
To create a cash flow forecast in Excel, you need a list of your cash inflows, such as sales, investments, or loans, and cash outflows like rent, payroll, or taxes. You’ll also need to use simple Excel functions, like SUM, to calculate totals and net cash flow over a selected period.
The most useful Excel functions for cash flow forecasting include SUM for totaling inflows and outflows, IF for conditional forecasts, NPV to calculate the present value of future cash flows, and IRR to evaluate investment returns. These functions help build a reliable and flexible cash flow forecast Excel model.
Yes, AI tools can make forecasting much easier. For example, Ajelix offers 10 AI tools designed for Excel. For example, its AI Data Analyst works like ChatGPT but is built for spreadsheet tasks. It can forecast cash flow, clean up messy data, and extract insights automatically, making the process faster and more accurate.
Speed up your spreadsheet tasks with Ajelix AI in Excel