How to Create a Budget in Excel + Free Budget Template

Knowing how to create a budget in Excel is essential for financial success, and good old Excel makes budgeting easy. In this article, you’ll learn how to prepare a budget in Excel and also how to make a budget sheet in Excel to keep your finances on track.
We’ll go over setting up the spreadsheet, entering your income and expenses, and tracking your progress.
We have also created an Excel Budget Template: Download it for free at the end of the article!
Step 1: Set Up Your Spreadsheet for Budget in Excel
The first step to creating a budget in Excel is to set up the spreadsheet. You can start with a blank spreadsheet or use an Excel template to get started.
We used the free Template Generator that receives an Excel file with the right columns and rows. If you choose to use a template, you can find budget templates for different budgeting needs, including monthly and yearly budgeting.
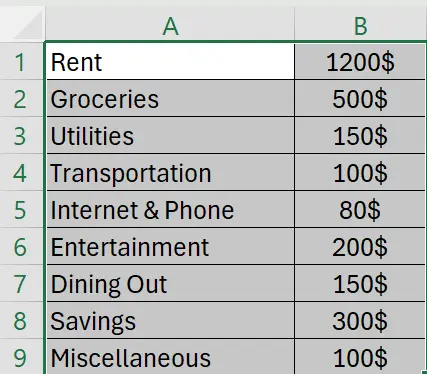
To create a budget from scratch in Excel, start by creating two columns for income and expenses. Label the first column “Income” and the second column “Expenses”. Create additional columns for each expense category, such as rent, food, clothing, and entertainment. Once you have all your columns set up, you can begin entering your income and expenses.
Step 2: Enter Your Income and Expenses
Once you have your spreadsheet set up, you can start entering your income and expenses. Start by entering your income amount in the “Income” column. This should include all sources of income, such as salary, investments, and other sources of income.
After you’ve entered your income, you can begin entering your expenses. Start by entering the amounts for each expense category in the appropriate column. Be sure to include all your expenses, including rent, utilities, food, clothing, and entertainment.
Once you’ve entered all your income and expenses, you can add up the totals for each column. This will tell you how much money you have coming in and how much you’re spending.
Step 3: Track Your Progress
Once you have your income and expenses entered, you can start tracking your progress. This can be done by adding a column for “savings” and entering a percentage of your income and expenses that you’d like to save each month.
Another way to track your progress is to create a chart or graph of your income and expenses. This will allow you to see your spending patterns over time, making it easier to identify areas where you can cut back or save more.
How to Create a Budget Graph in Excel?
Time needed: 1 minute
Let’s look at a super simple way how to create a budget graph:
- Select your data range
- Go to the “Insert” tab
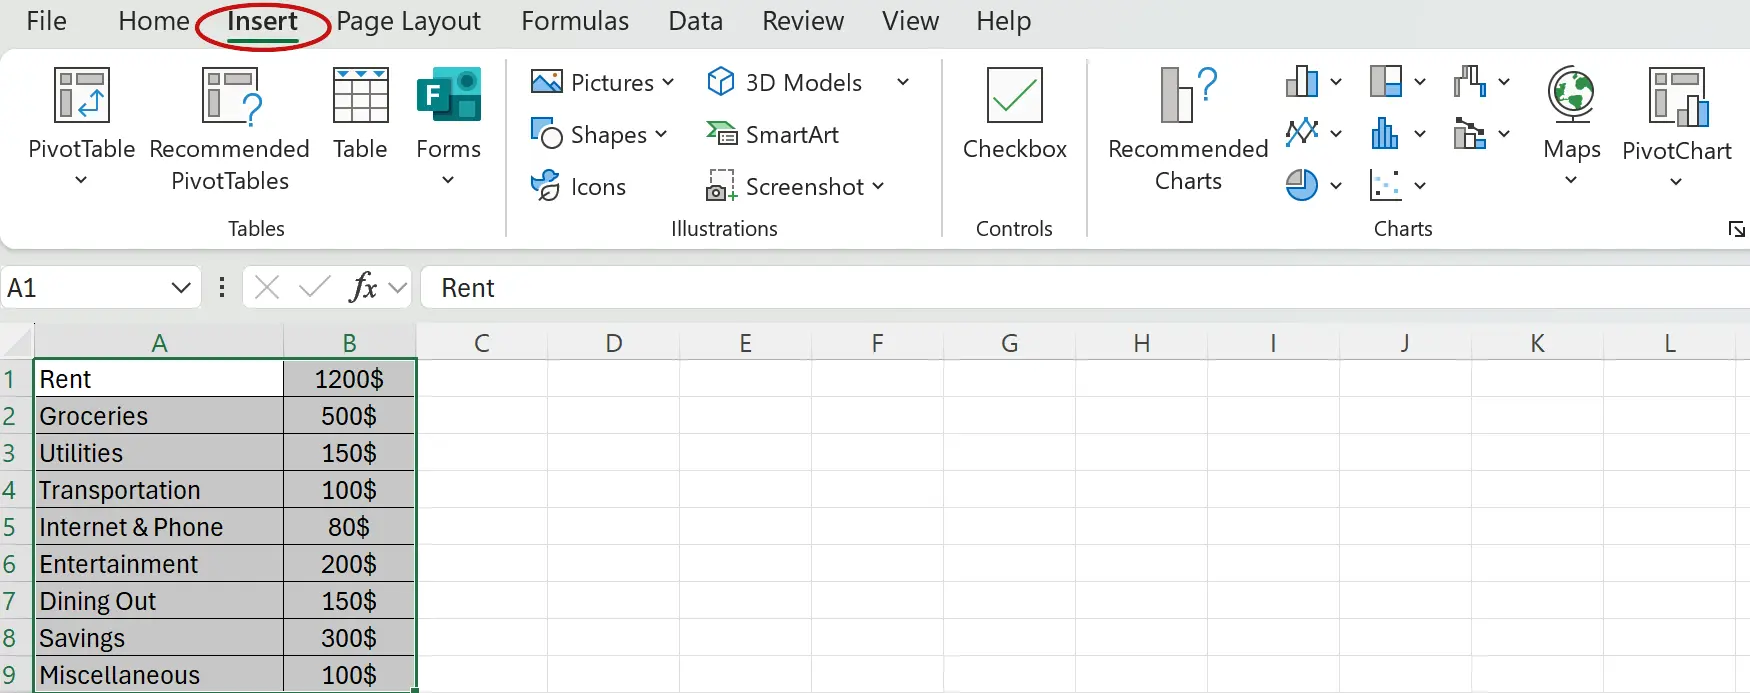
- Choose your desired chart type
Chart type varies according to your needs: a bar/column chart is best for comparing expense categories, a pie chart is best for a percentage breakdown of expenses, and a line chart is good for tracking expenses over time.
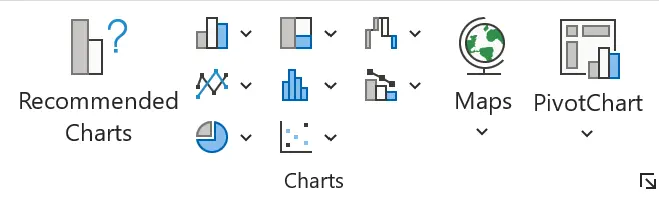
- Click on your selected chart type and voilà – Budget Graph is created!
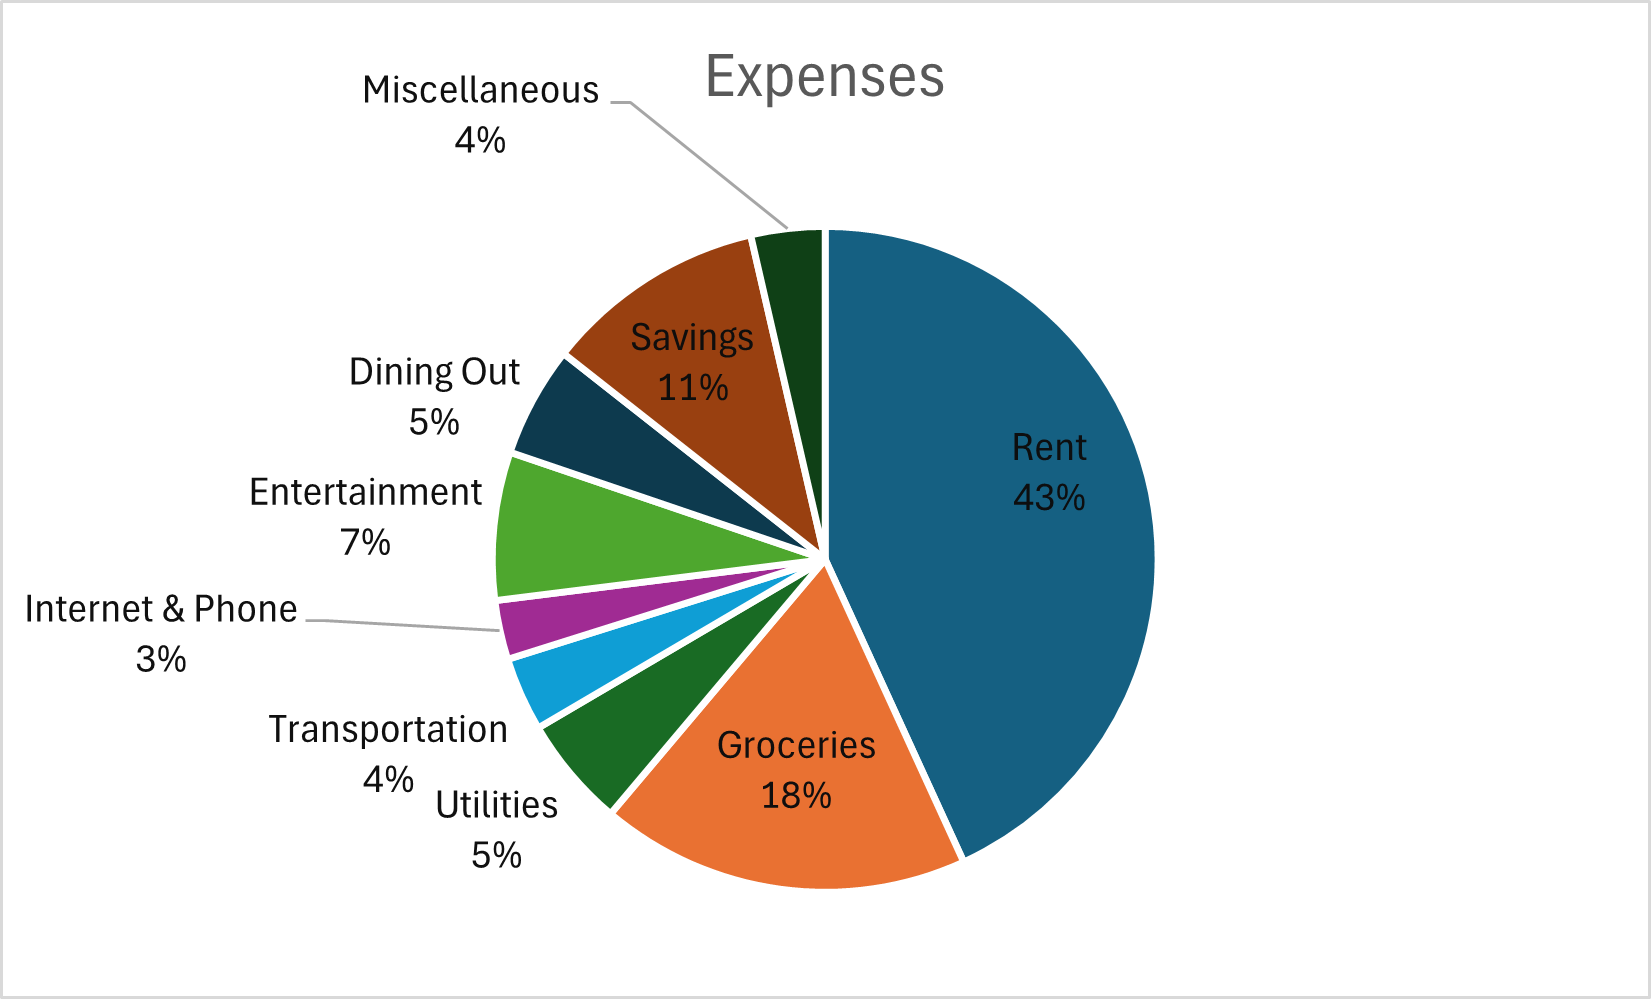
We chose a Pie Chart because our aim was to see the percentage breakdown of all the expenses.
Small hack – there is an easier way how to create a graph. Make AI do it! For free & no sign-up required:
Conclusion
See, with the right approach, budgeting in Excel can be simple and effective! Now that you understand how to create a budget in Excel, you can confidently track your income, expenses, and savings.
Whether it’s a personal or business budget, using a structured budget spreadsheet in Excel will keep your finances in check and help you make informed decisions. As you know, we’ve already created a template, so you don’t have to. Enjoy it for free!
Learn more about Excel and Google Sheets hacks in our other articles.
Want to stay in the deep research and tricks loop? Sure, let’s stay connected.
Excel Personal Budget Template: Free Download
FAQ
Excel makes budgeting easy by allowing you to track income, expenses, and savings in a structured format with customizable templates.
Start by setting up columns for income and expenses, then list different expense categories such as rent, food, and entertainment.
Yes! You can download the Ajelix Excel budget template or use the Template Generator to create a custom one.
Use charts or graphs—a bar chart for comparing expenses, a pie chart for percentage breakdowns, or a line chart for tracking trends over time.
Speed up your spreadsheet tasks with Ajelix AI in Excel