What Is Business Intelligence (BI) And Analytics?

In today’s fast-paced business world, understanding business intelligence, data and analytics is no longer a luxury—it’s a necessity.
What is BI, you ask? Business Intelligence is the key to unlocking valuable insights from your data.
In this article, we’ll take you through the data and business intelligence roadmap, examining how BI and analytics can improve your decision-making, boost efficiency, and help your business grow.
Table of Contents:
- The Basics of Business Intelligence
- Key Components of the Business Intelligence Roadmap
- The Power of Data
- What is Data Analytics?
- How To Implement Business Intelligence?
- Differences Between Data Analysts vs Data Scientists
- 3 Emerging Trends in BI and Analytics
- What are Some Popular Business Intelligence and Analytics Tools?
- Conclusion
- FAQ
The Basics of Business Intelligence
The Business Intelligence (BI) Definition
At its core, Business Intelligence (BI) refers to the processes, technologies, and tools that transform raw data into meaningful insights. It empowers businesses to make informed decisions by tapping into the treasure trove of information they generate daily.
The Purpose of BI
Business Intelligence (BI) helps business owners make smarter decisions by turning data into useful insights. It looks at past trends, identifies patterns, and even predicts what might happen next.
By streamlining processes and highlighting opportunities, BI makes businesses more efficient and better prepared for challenges.
At its core, BI is about using data to work smarter, not harder. That is why we love it so much. Who wants to work hard, right? Our Ajelix BI Platform does everything for us and our non-tech clients, and it’s an absolute win-win.
Reporting gives you a headache?
Upload your data and create professional reports with agentic AI

Start free
Try free and upgrade whenever
Key Components of the Business Intelligence Roadmap
We’ve created a BI Roadmap with 5 key points.
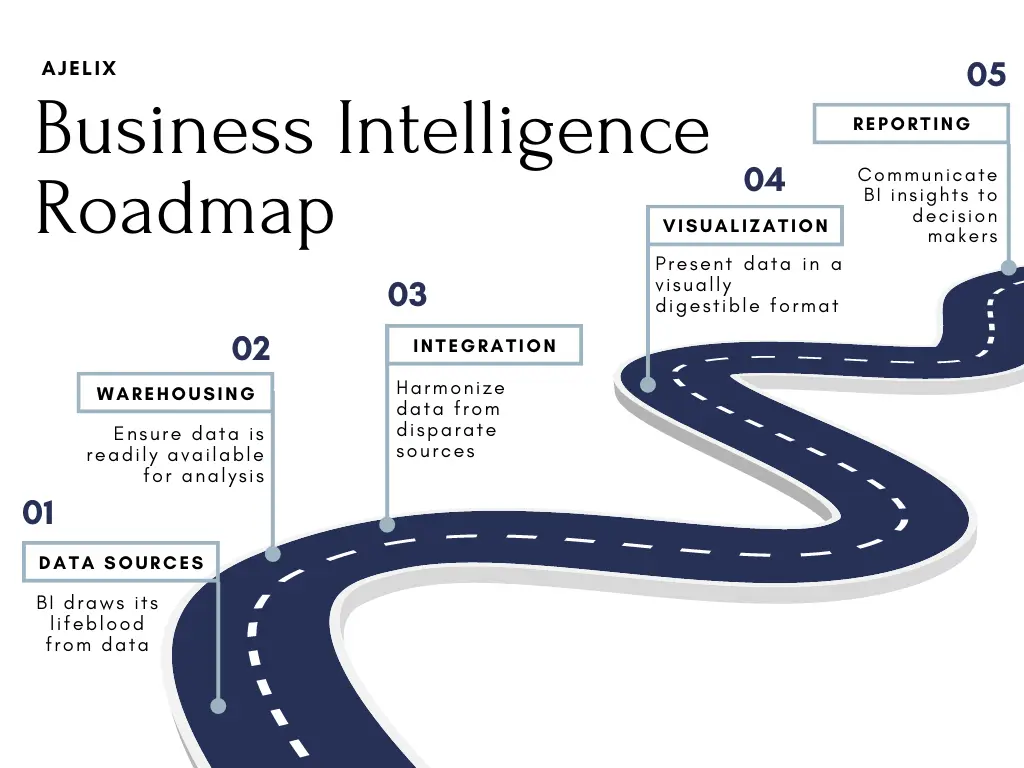
Business Intelligence Roadmap Infographic for businesses and organizations (created by author)
Let’s look at our BI Roadmap Components more closely:
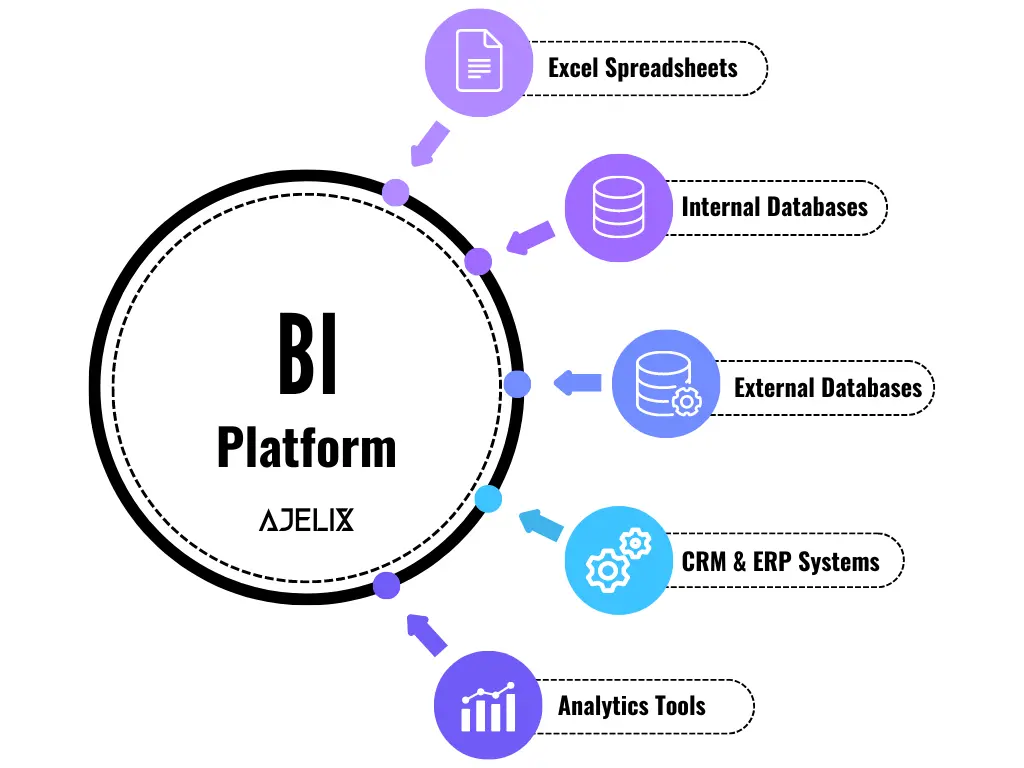
1. Data Sources
BI draws its lifeblood from data, and then the analytics” task is to find this data and connect the dots. Data sources can range from internal databases to external data providers, all contributing to a comprehensive view of business operations.
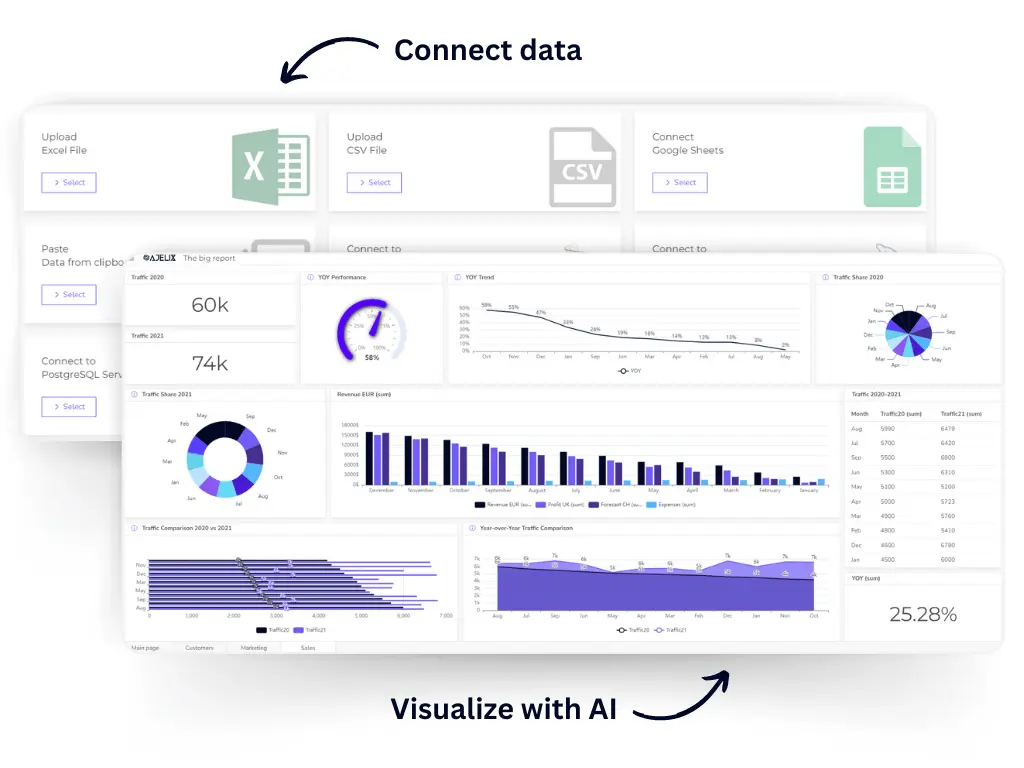
For a better understanding of the term, check the data sources of our BI Platform:
2. Data Warehousing
Data warehousing is the collection, storing, and organizing of your data in a structured way. A business intelligence database acts as a foundation for all your BI solutions.
3. Data Integration
Data integration involves harmonizing your data from disparate sources, making it compatible and coherent. This step is essential to create a unified business intelligence data analysis and reporting for applications. Data integration tools can help streamline this process, ensuring efficiency and accuracy.
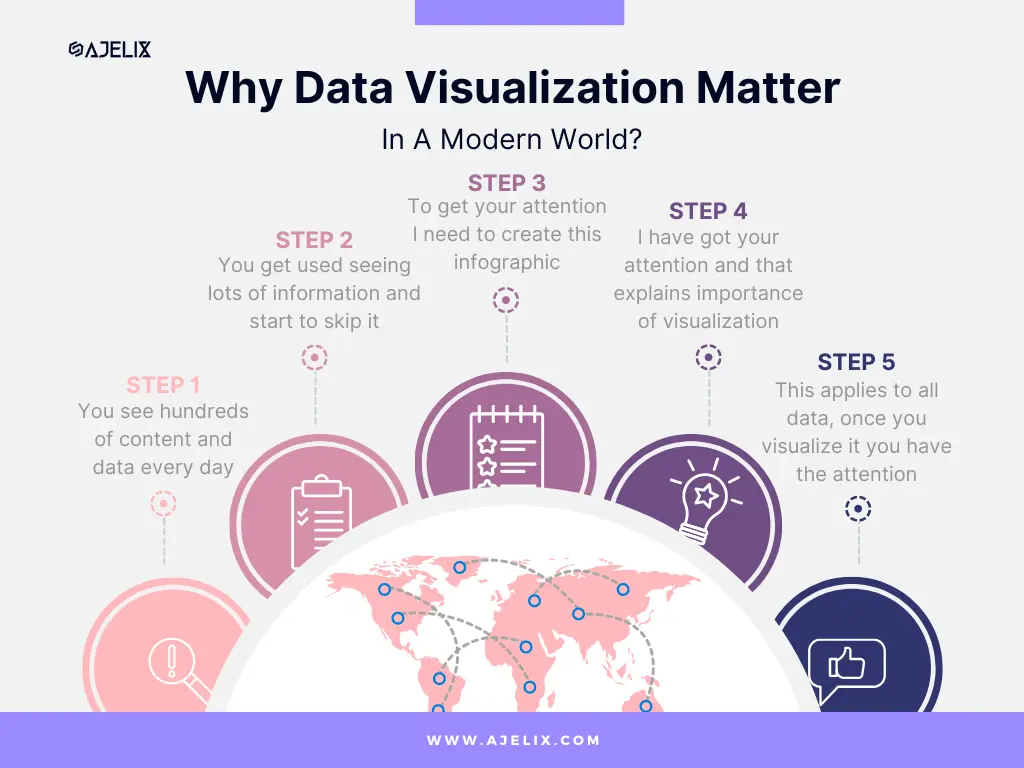
4. Data Visualization
In a world of big data analytics, presenting information in a visually digestible format is super important. Data visualization tools can transform your complex data into understandable charts, graphs, and dashboards. This improves your understanding of your business processes but also your colleagues’ understanding.
Here is our infographic proving why data visualization is the key:
5. Reporting Tools
Creatively speaking, reporting tools are the storytellers of the BI world and a great deal of BI software. With reporting tools you can generate reports that communicate insights to decision-makers in a clear and actionable manner.
This might interest you: Best Online Reporting Tools
The Power of Data
Data is more than just a byproduct of business; it’s a powerful asset. When used right, it can spark innovation and reveal hidden opportunities. With the help of business intelligence tools, companies can tap into their data’s true potential to grow.
What are the Three Vs of Data?
The three Vs of big data—volume, variety, and velocity—highlight the challenges and opportunities.

Infographic explaining 3 data fundaments – velocity, volume, and variety (created by author)
The 3 Vs of Big Data and their meaning:
- Volume: Refers to the sheer amount of data generated. The challenge is managing and storing vast quantities, but it also offers opportunities to uncover valuable insights from large datasets.
- Variety: Involves the different types of data (structured, unstructured, text, images, etc.). The challenge is integrating and analyzing different data sources, but it opens up the chance to gain richer, more understandable insights.
- Velocity: Refers to the speed at which data is generated and needs to be processed. The challenge is keeping up with real-time data, but it presents opportunities to make quick, data-driven decisions.
Structured vs Unstructured Data
Organizing data is essential for effective analysis. If you’re not organizing your data… well, bad news: you have to start structuring those mountains of data
By structuring data—such as using databases—it becomes easier for you to analyze and get insights. Separating structured data from unstructured data, like customer feedback, helps ensure that each type is handled appropriately, making the analysis more accurate and actionable.
Data Quality and Integrity
The saying “garbage in, garbage out” is especially relevant in Business Intelligence (BI) and competitive intelligence. The quality and integrity of your data directly impact the accuracy and reliability of the insights derived from it. If your data is incomplete, outdated, or inaccurate, any analysis or reports generated will be flawed, leading to poor decision-making.
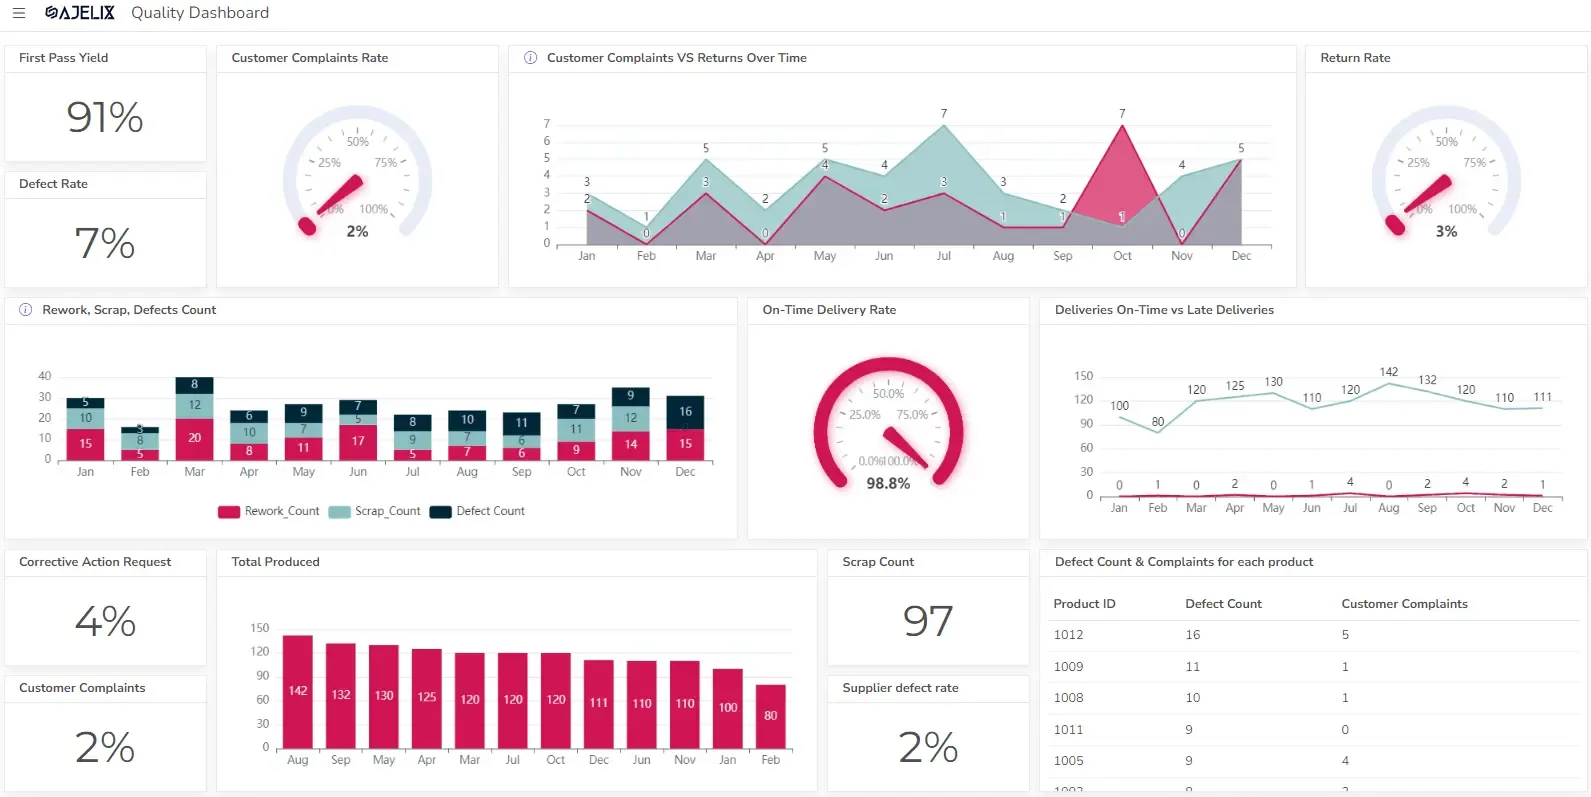
On the other hand, high-quality data ensures that the results from your BI tools, such as dashboards and reports, provide clear, actionable insights. For businesses to make informed, strategic decisions, it’s crucial to maintain data integrity by regularly cleaning, validating, and updating data sources. Only then your analysis will drive meaningful outcomes.
What Is Data Analytics?
Data analytics is a term you should focus on understanding. Data Analytics involves the systematic exploration of data to extract meaningful patterns, insights, and knowledge. It’s the process of turning data into actionable information.
The 4 Types of Data Analytics
Analytics isn’t a one-size-fits-all approach; it comes in various flavors, each serving a specific purpose:
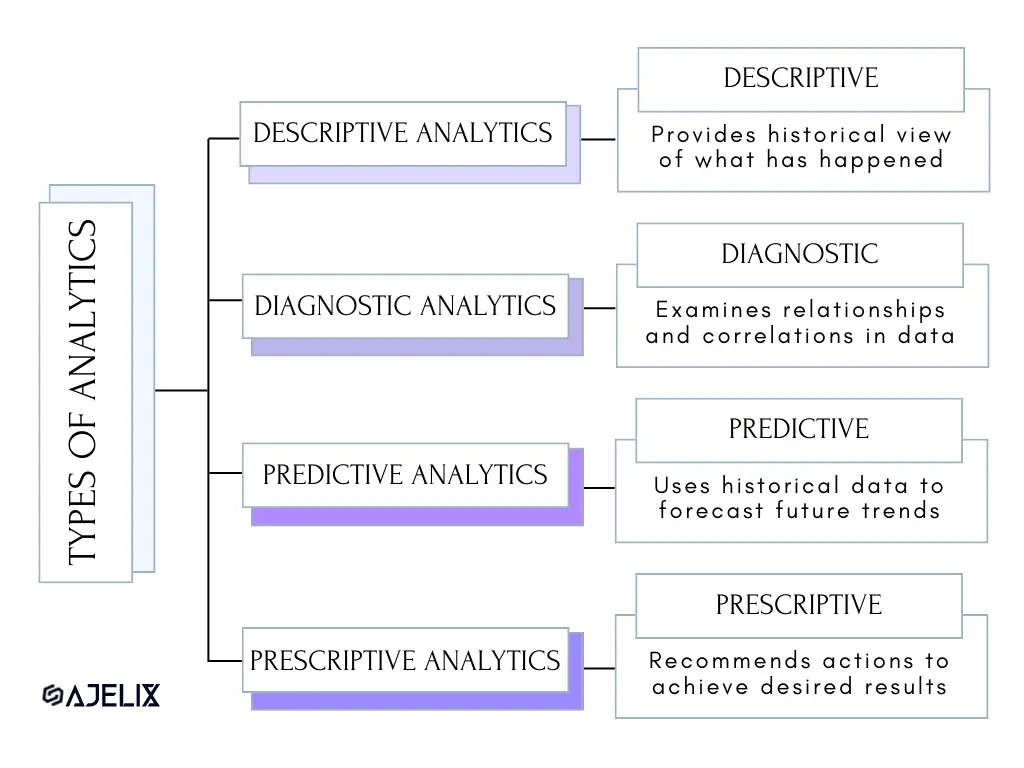
Here are the 4 types of analytics and their meaning:
- Descriptive Analytics provides a historical view of what has happened, helping businesses understand past performance.
- Diagnostic Analytics dives deeper, seeking to understand why certain events occurred by examining relationships and correlations in data.
- Predictive Analytics leaps into the future, using historical data to forecast future trends and outcomes.
- Prescriptive Analytics goes a step further by not only predicting outcomes but also recommending actions to achieve desired results.
What Is The Difference Between Business Intelligence and Analytics?
Glad you asked!
Here is The Business Intelligence Definition:
BI focuses on descriptive reporting and answering questions like “What happened?” and “What is happening now?” It enables organizations to monitor their performance and make informed decisions based on past and current data.
Here is The Analytics Definition:
Analytics is a broader field that examines data to discover patterns, trends, and insights. It goes beyond historical and current data, aiming to answer questions like “Why did it happen?” and “What might happen in the future?”
So, in short, analytics digs deeper. Analytics seeks more of a why? solution, while BI needs more of a what? answer.
How To Implement Business Intelligence?
Here’s a breakdown of the key steps to implementing Business Intelligence (BI) in your organization:
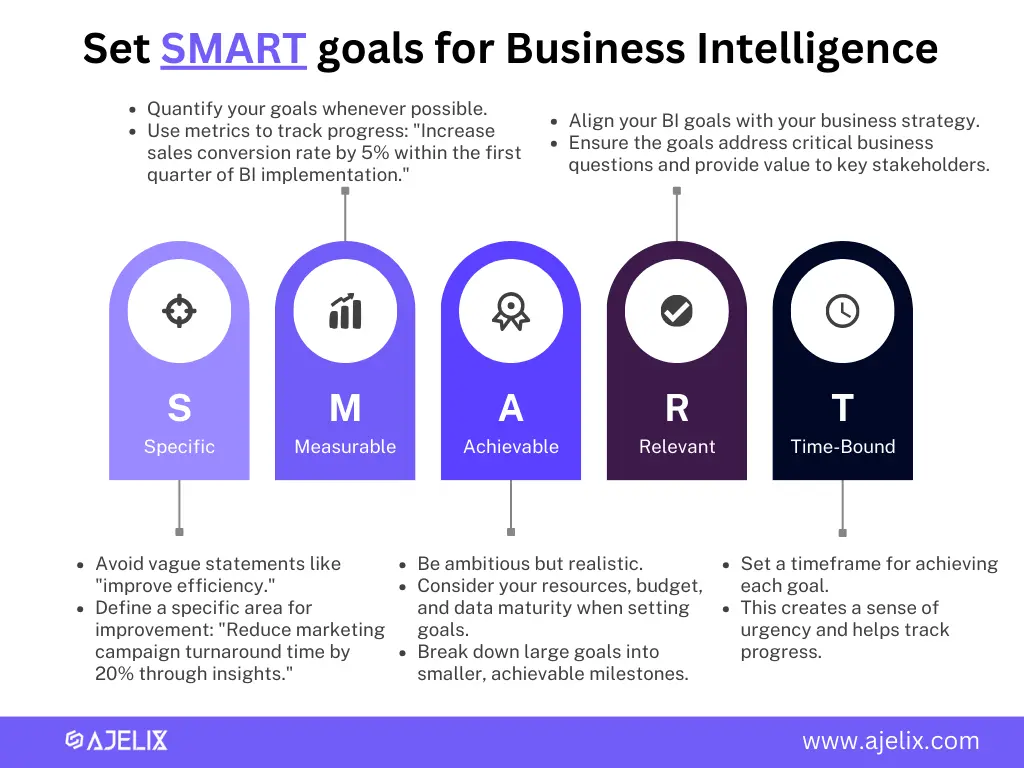
- Define Your Needs
Analyze your current data landscape and identify areas where BI can provide value. What business questions do you want to answer? Who are the key stakeholders who will be using BI reports and dashboards? If that helps, try setting SMART goals to define everything.
- Make Your Team
Identify individuals with data analysis skills, business knowledge, and project management expertise. If you’re using a BI Platform that is made for non-techies, like Ajelix, then searching for data pros is not needed.
- Plan and Design
Choose your BI tools and technology stack based on your needs and budget. Design the data warehouse or data lake to store and manage your data. Develop a data governance plan to ensure data quality and security.
- Data Acquisition and Integration
Identify all your data sources (internal databases, customer relationship management systems, etc.). Establish processes to extract, transform, and load (ETL) data into your BI system. You can try using the Ajelix BI platform for easy SQL server connection of simple data upload.
- Develop Dashboards and Reports
Design user-friendly dashboards and reports that answer your key business questions. Consider visual hierarchy and user experience for effective communication of insights.
- Pilot and Train Users
Run a pilot program with a small group to test the functionality and gather feedback. Train users on how to access, navigate, and interpret the BI reports and dashboards.
- Deployment and Ongoing Support
Launch the BI system for all users and monitor its performance. Provide ongoing support to users and address any technical issues.
- Refine and Evolve
Regularly review your BI dashboards and reports to ensure they remain relevant. Gather user feedback and adapt your BI strategy based on evolving business needs.
Remember: BI implementation is an iterative process. Be prepared to adapt your approach as you learn more about your data and user needs.
Data Collection and Integration
Gathering data from various sources and integrating it into a centralized data warehouse is the first step. This ensures a single source of truth for analysis.
One popular technique for data gathering is web scraping PHP. Essentially, web scraping involves programmatically extracting and processing data from websites -largely made possible by various PHP libraries. The process involves navigating to different URLs, analyzing HTML code, and extracting the required information from these web pages to be integrated into your data warehouse. It’s a reliable and efficient method of data collection for any business intelligence initiative.
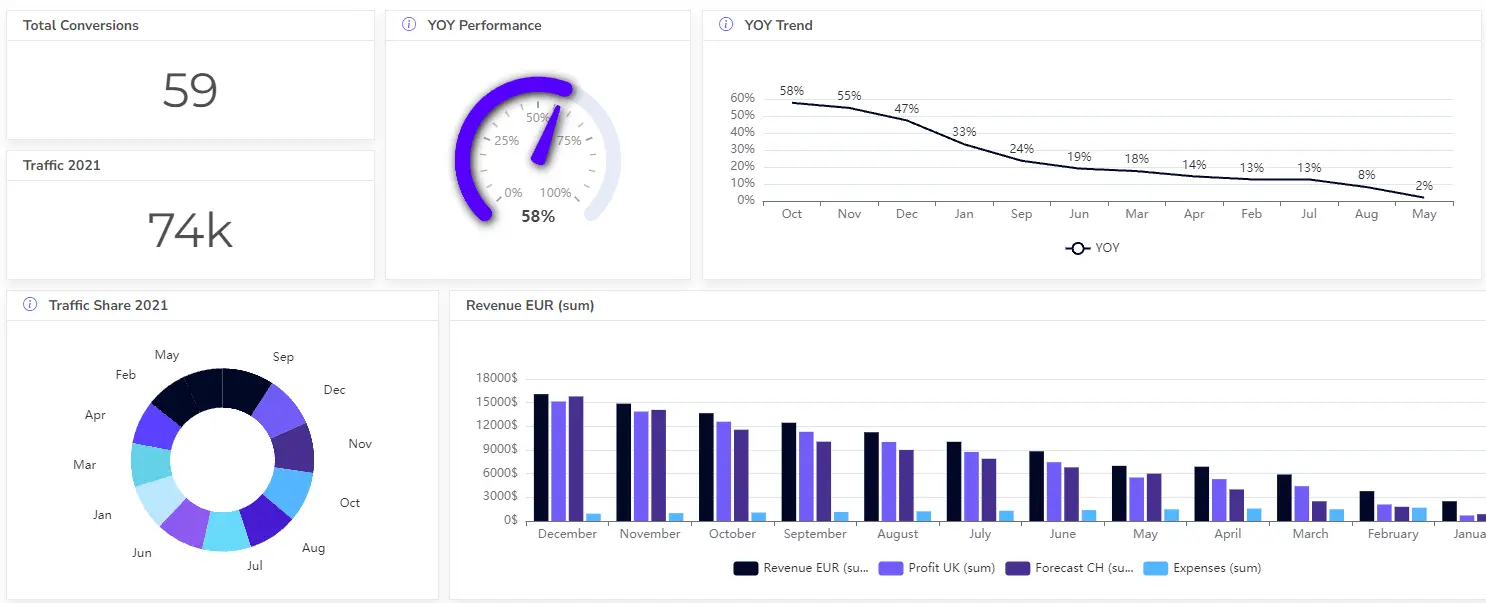
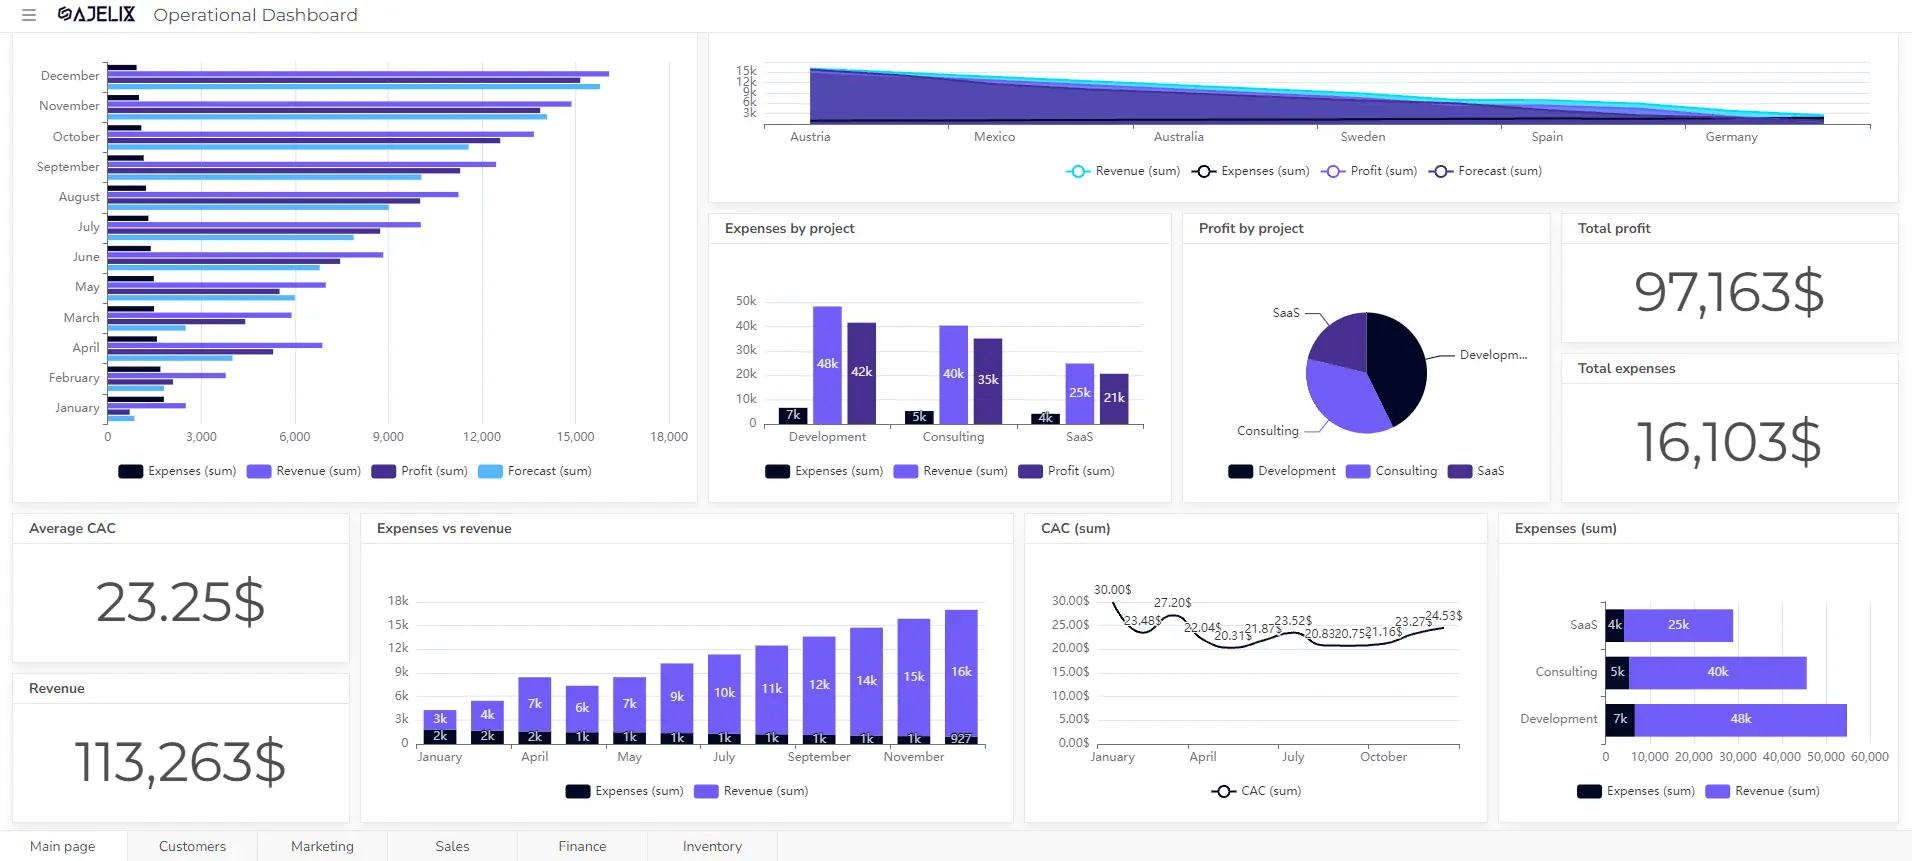
Data Visualization and Dashboards
Effective data visualization is key to making insights accessible. Design your dashboards and reports with end-users in mind for maximum impact. For a more detailed guide read our blog on how to create an effective data visualization dashboard.
Differences Between Data Analysts vs Data Scientists
Will Data Analysts be replaced by AI? Is Data Scientist a good career? What is the difference between Data Analysts and Data Scientists? These are some common questions, so let’s clear things out. While both roles deal with data, they have different functions:
Data Analysts focus on interpreting data, creating reports, and generating insights to inform decision-making.
Data Scientists are the wizards of data. They delve deep into data, using advanced statistical and machine-learning techniques to unearth hidden patterns and build predictive models.
For example, by integrating AI tools, both data analysts and data scientists can dive deeper into influencer databases, customer spreadsheets, and cloud storage to understand audience behavior, personalize customer experiences, predict consumer behavior, and identify effective marketing opportunities.
Here is a quick comparison of Data Analysts and Data Scientists
| Skill | Data Analyst | Data Scientist |
|---|---|---|
| Primary Focus | Analyze existing data to answer questions and identify trends | Develop models and algorithms to predict future outcomes and solve complex problems |
| Data Skills | Proficient in data cleaning, manipulation, and visualization | Strong foundation in statistics, machine learning, and programming languages like Python and R |
| Tools Used | Excel, SQL, and data visualization tools (e.g., Tableau, Power BI) | Programming languages, machine learning libraries, cloud computing platforms |
| Decision Making | Provide insights to inform business decisions | Develop models to automate decision-making processes |
| Educational Background | Bachelor’s degree in Business Analytics, Statistics, or related field | Master’s degree in Data Science, Computer Science, or a related field (often with a strong math and statistics background) |
3 Emerging Trends in BI and Analytics
The BI and Analytics world is constantly changing. So, let’s look at 3 trends in this field!
1. Artificial Intelligence and Machine Learning
AI and Machine Learning (ML) are changing the Business Intelligence (BI) field, making data analysis faster, smarter, and more efficient. Instead of sifting through endless spreadsheets, businesses can now automate complex analytics, saving time and uncovering insights instantly.
Predictive modeling is a game-changer, helping companies anticipate trends, optimize operations, and reduce risks. AI-powered anomaly detection also flags irregularities before they become bigger issues.
At Ajelix, we also love this new era of AI data-driven insights. We’ve incorporated AI in our efficiency tools and also in our BI Platform, of course.
For example, our AI Spreadsheet Assistant Ajuna is the best on the market and helps our users with any issues regarding data and analytics.
2. Self-Service BI
Self-service BI tools help non-techies by providing intuitive interfaces and user-friendly functionalities that enable them to perform data analysis independently.
This might interest you: 7 Best Self-Service BI Tools
These tools minimize the need for IT teams or specialized data professionals, allowing anyone to generate reports, create visualizations, and gain insights from data without requiring advanced technical skills.
See how our AI Dashboard Generator in our Self-Service Platform for non-techies works:
3. Mobile BI
In an increasingly mobile world, access to data on the go is essential. Mobile BI apps are rising as they enable everyone to stay informed anytime, anywhere.
This improves productivity and collaboration and fastens decision-making.
What are Some Popular Business Intelligence and Analytics Tools?
It’s important to choose the right BI and Analytics tool, so let’s look at the features, benefits, and best uses for the most popular ones. From industry giants to innovative newcomers, there’s a tool for every need.
This might interest you: an in-depth comparison of the 14 Best Data Visualization Tools
Here’s a list of the leading BI and Analytics Tools:
- Ajelix BI: A self-service BI platform made for non-techies that uses artificial intelligence (AI) to automate data analysis tasks and help users identify patterns and trends in their data.
- Microsoft Power BI: A popular choice for businesses that already use Microsoft products. Power BI offers a wide range of features, including data visualization, reporting, and analytics.
- Tableau: Known for its user-friendly interface and drag-and-drop functionality
- Looker Studio (formerly Google Data Studio): A free and easy-to-use tool for creating data visualizations and dashboards. Looker Studio integrates well with other Google products, such as Google Sheets and Google Analytics.
- Qlik Sense: Another user-friendly option, Qlik Sense offers a unique associative data model that allows users to explore data from different angles.
- Domo: A cloud-based platform that offers a wide range of BI and analytics capabilities, including data visualization, reporting, and data warehousing.
Conclusion
To wrap it up, business intelligence and analytics are your secret weapons for turning data into powerful insights. Whether you’re still wondering what is BI or ready to dive in, following the business intelligence roadmap will help you harness the full potential of BI and analytics, driving smarter decisions and long-term success.
Has BI and Analytics Caught Your Interest? High Five! Our Blog Section is all about Data, Analytics, and AI.
Want to stay in the deep research and tricks loop? Sure, let’s stay connected.
FAQ
BI and Analytics use both structured and unstructured data. Structured data like sales figures and customer demographics is key, but things like social media comments and call center recordings (unstructured) are valuable too.
Popular BI and Analytics tools include Microsoft Power BI, Ajelix BI, Tableau, Looker Studio (formerly Google Data Studio), and Excel.
BI analyzes past data to understand trends, while AI uses that analysis to predict future trends, help discover insights, and even automate decisions. They work together for better insights.
Some BI trends include AI integration for smarter and quicker data analysis (augmented analytics) and focus on easing data understanding for non-techies with the rise of Self-service BI platforms.
From data to report in one minute or less with Ajelix BI