Ajelix BI Version 2 Is Live: More Analytics & More Power

Dicover other articles
Unleash the true power of your data! 💥 Ajelix, the dynamic AI-powered BI platform built for SMBs, is thrilled to announce the much-anticipated launch of Version 2.0. This update empowers you to take complete control of your data analysis, from in-depth cleaning and preparation to generating stunningly insightful reports.
What’s new on Version 2.0
Ajelix BI team has worked with version 2 for the last 6 months. This is one of the biggest updates, including 40+ new features.
More advanced analytics
This version empowers you to become a data pro with advanced preparation tools and the ability to combine information from various sources into informative dashboards. You can even create custom data tables and leverage pivot tables for in-depth analysis.
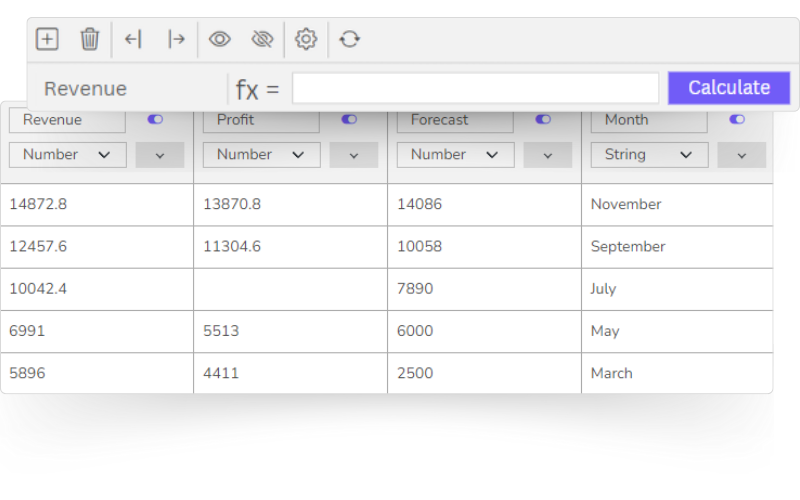
1. Prepare and clean your data before visualization
Transform your messy data into concise and clean data—ready for analytics. Using a data modeling editor you can format or change data structure. Transform and filter data using custom functions. Clean, remove duplicates, hide or delete unnecessary data
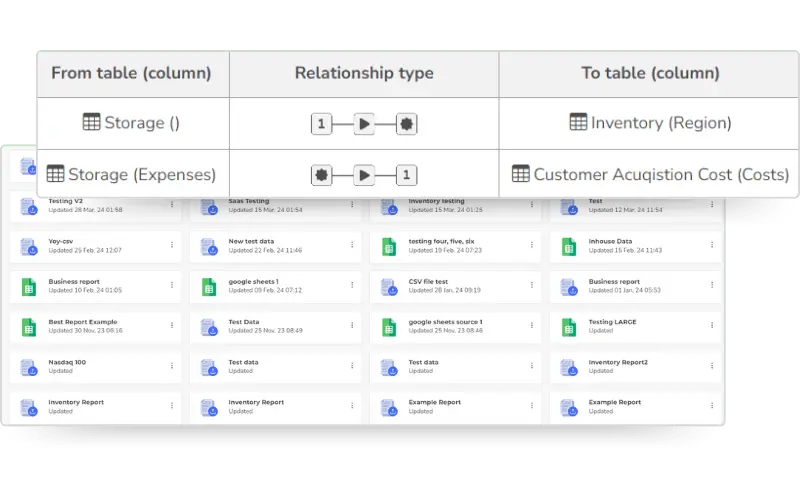
2. Use several data sources for one dashboard
Create more advanced visualizations from different data sources and manage all your files in one place. Merge and connect data, and set up relationships for deeper analytics.
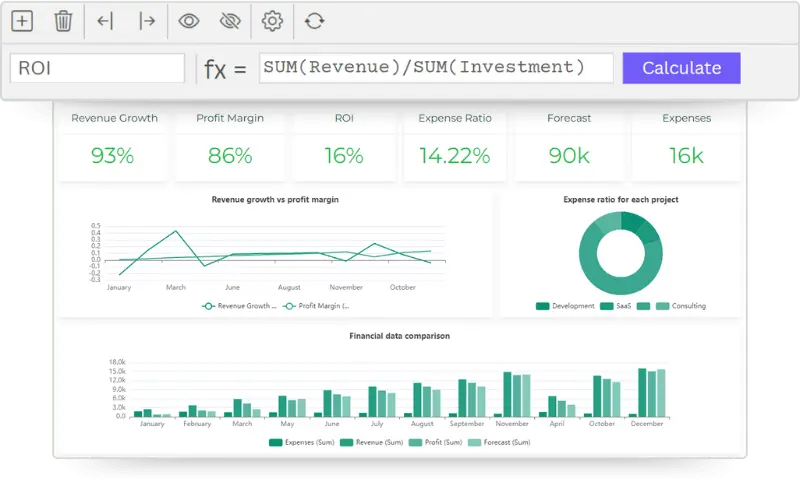
3. Create and track KPIs
Set up your business metrics and KPIs using SQL functions. Create new fields and columns from your data and perform calculations from different data sources.
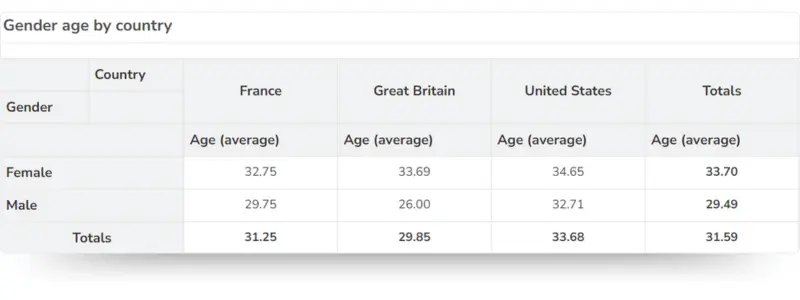
4. Use Pivot tables for deeper analytics
Drag and drop data to create pivot tables for your dashboards.
Enjoy more customized reports
Craft highly customized reports tailored to your specific needs. Version 2.0 boasts a wider range of chart customization options, new color and axis settings, and the ability to create multi-page dashboards for a truly comprehensive data narrative.
1. More settings for chart customization
Set up colors for each axis, and manage number formatting, labels, and axis settings.

2. Create several pages within one dashboard
Now you can add as many pages as you like within one dashboard.
Explore advanced analytics with AI
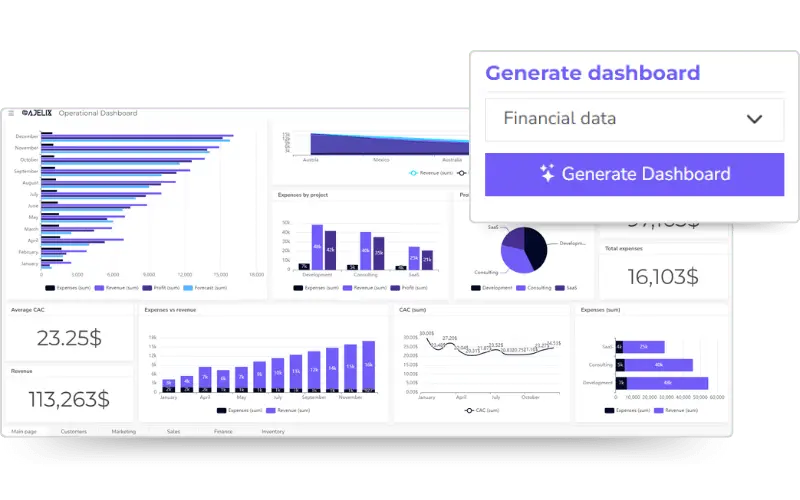
Ajelix 2.0 takes data analysis to the next level with its advanced AI features. Experience a smarter dashboard generator that curates the most impactful visualizations based on your data, saving you valuable time and effort.
1. More analytical and meaningful dashboard generator
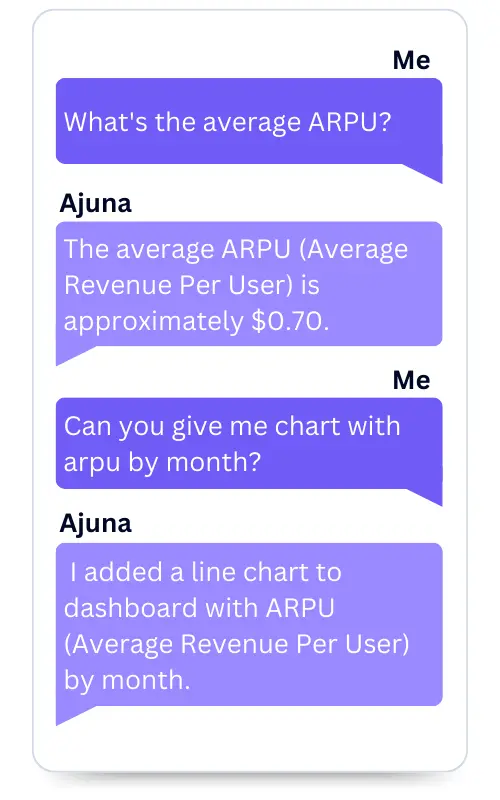
2. AI chat analytics
Chat about your data with conversational analytics. Ask questions, calculations, or charts to get answers from AI. Ajelix 2.0 paves the way for AI-powered chat analytics, providing invaluable insights into data and behavior.
This was a recap of the most important new BI features. To better understand the big picture dig deeper into the platform and explore features on your own.
Reporting gives you a headache?
Upload your data and create professional reports with agentic AI

Start free
Try free and upgrade whenever
About Ajelix Team
Ajelix was first heard in 2022 when two founders from Latvia launched AI spreadsheet tools that reached more than 70,000 active users in the first months. The team has more than 10 years of development experience and has grown the BI platforms user base to 200,000.
Agentic AI chat that helps you complete projects

