Marketing Reports: What Should Be Your Focus When Creating One

Do you know Metallica’s song “Nothing Else Matters”? Well, when it comes to marketing reports, that’s true because without them nothing else really matters. In the long run, it doesn’t matter what content you make, which channels you use, or which trends you follow because you can’t exactly know what’s working and what’s not. Marketing reports let you make smart decisions that lead to smart strategies.
TL;DR
Marketing reports are essential for understanding what works, improving campaigns, and making data-driven decisions. Common types include social media, advertising, email, event, and SEO reports. Key elements are metrics/KPIs, performance analysis, audience insights, budget/ROI, and actionable recommendations. Avoid common mistakes like overloading data, missing next steps, and ignoring context. Tools like Ajelix can simplify report creation and visualization, turning data into clear, actionable insights.
Let’s take a deeper look into the importance of marketing reports and how to make your own! It’s time to start tracking those marketing success fruits.
Table of Contents:
- Why Do Marketing Reports Matter?
- The Most Common Types of Marketing Reports
- Publishing Data Report: Spotify Example
- Key Components of Your Marketing Report
- Chief Marketing Officer Report Example
- How to Create a Marketing Report in Ajelix BI?
- Common Mistakes to Avoid in Your Marketing Report
- Conclusion
- FAQ
Why Do Marketing Reports Matter?
It’s simple. Marketing reports are a must for every business that wants to grow. Sorry, if it sounds harsh but it’s true.
Marketing reports can help you understand what’s working, what needs improvement, and where to focus your efforts. With clear insights into customer behavior, campaign performance, and market trends, you can make smarter decisions and maximize your results. Tracking data ensures you stay ahead of the competition and keep your marketing strategy on the right path.
You might be interested: Marketing Data Visualization Practices
For example, a social media marketing report can show you which platforms drive the most engagement, what content resonates with your audience, and how your ads are performing.
Independent researchers’ study on marketing analytics for SMEs, published in the World Journal of Advanced Science and Technology, highlights that the key benefits of marketing reports for SMEs are improved customer targeting, enhanced campaign effectiveness, increased ROI, and overall business growth.
Reporting gives you a headache?
Upload your data and create professional reports with agentic AI

Start free
Try free and upgrade whenever
The Most Common Types of Marketing Reports
There are many types of marketing reports, but let’s not get overwhelmed and focus on the 5 most common ones.
| Report Type | Use + Examples of Metrics |
|---|---|
| Social Media Reports | Social media is an important channel for building brand awareness and engaging with your audience. Social media report metrics: follower growth, engagement rates, and click-through rates. |
| Advertising Reports | Paid advertising campaigns, like Google Ads or Meta Ads, can help you reach a targeted audience and drive immediate results. Advertising report metrics: cost-per-click (CPC), click-through rates (CTR), conversion rates, and overall return on ad spend (ROAS). |
| Email Marketing Reports | Email marketing is a powerful tool for reaching your audience directly and driving conversions. Email marketing report metrics: open rates, click-through rates, unsubscribe rates, and conversions from each campaign. |
| Event Marketing Reports | Marketing events such as trade shows, seminars, or in-store promotions can increase customer engagement and loyalty to the brand. Event marketing report metrics: attendance, lead generation, customer interactions, and sales during or after the event. |
| SEO Reports | SEO is essential for driving organic traffic and improving your website’s visibility. SEO report metrics: keyword rankings, organic traffic, bounce rates, and backlinks. |
Publishing Data Report: Spotify Example
Many businesses, including Spotify, Apple, and Amazon, publicly share their financial and marketing reports. Why? Because it’s a powerful, data-driven way to showcase growth, build credibility, and engage both customers and investors. These reports act as a form of strategic advertising, reinforcing their success and market position.
Take Spotify’s latest Q4 2024 report, for example. The company revealed impressive growth, for example, stating that subscribers count was rising by 11% to 263 million and how their total revenue grew by 16% to €4.2 billion. These figures highlight Spotify’s strong financial performance, and the way they present the data makes it even more impactful.
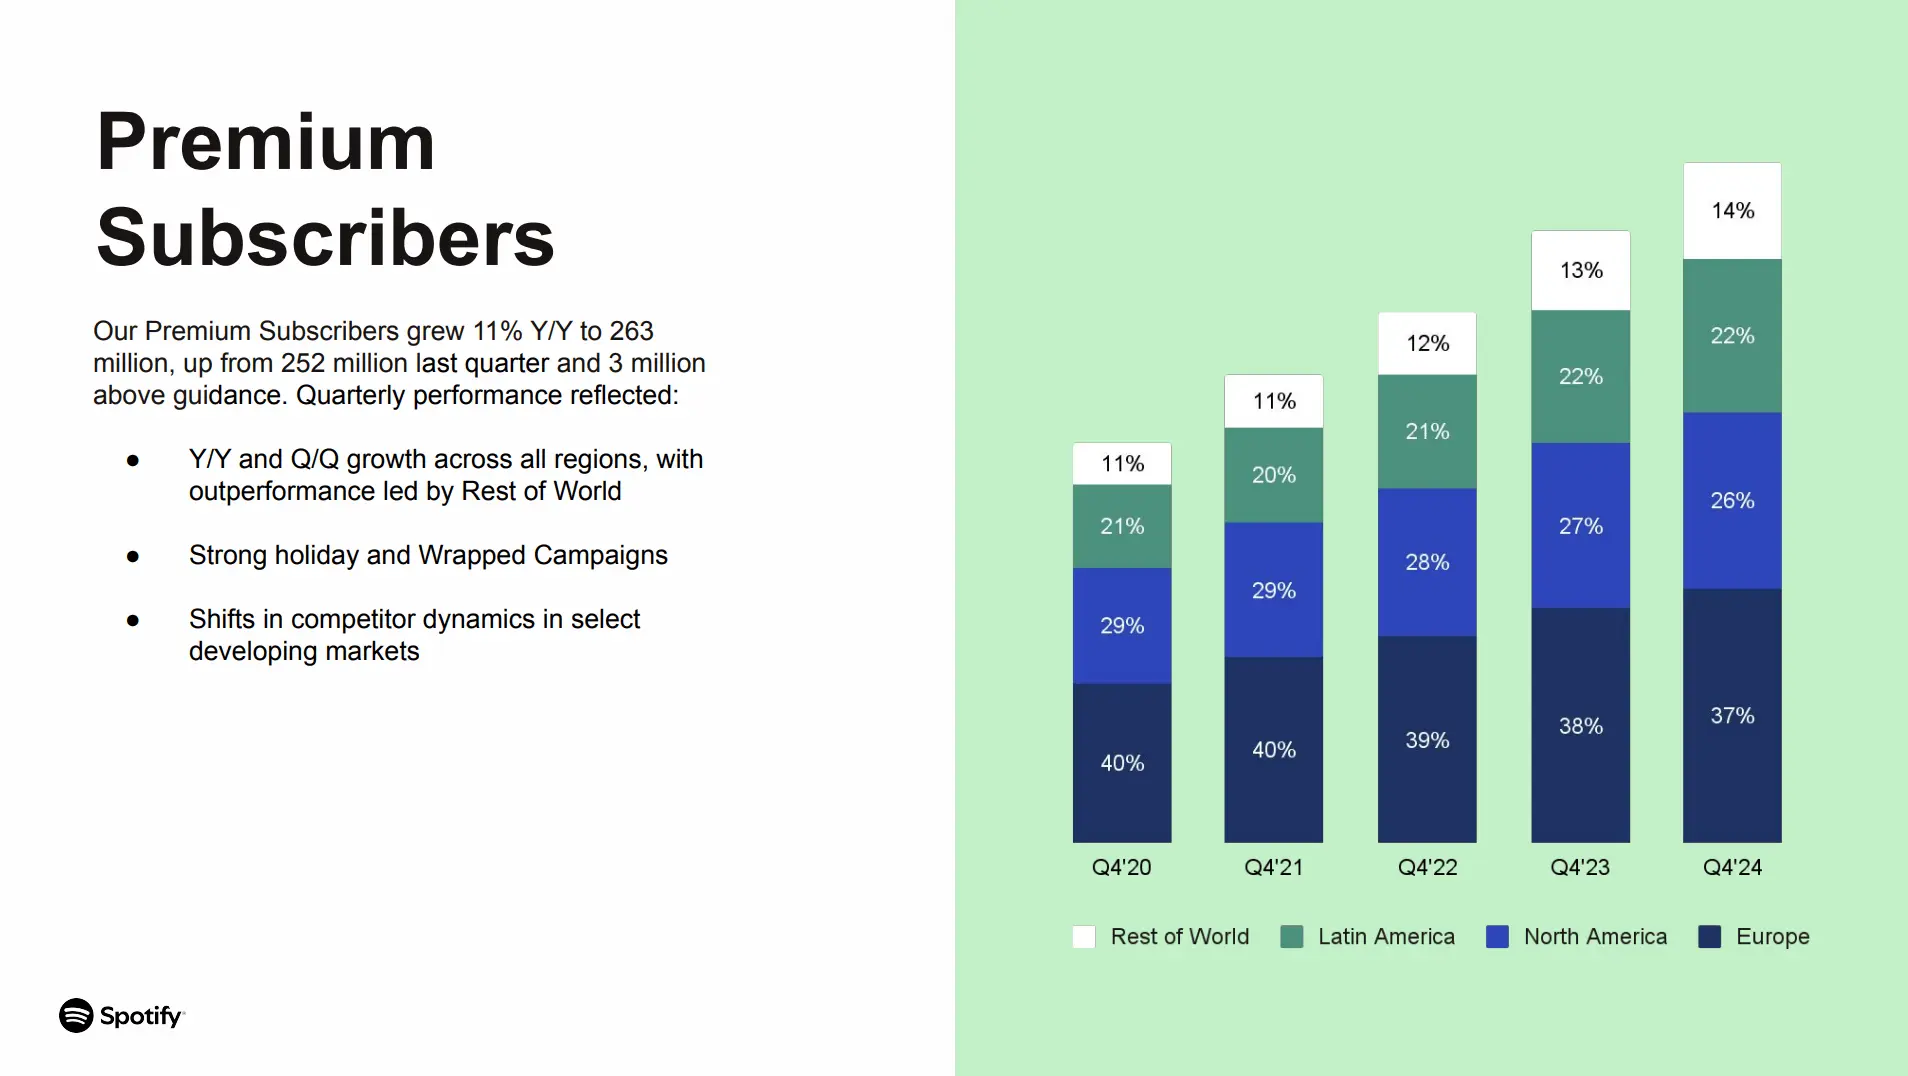
Rather than just listing numbers, Spotify transforms its reports into a compelling brand story. Statements like “We celebrated our biggest Spotify Wrapped campaign ever, which delivered record-high user engagement (+10% YoY) across 184 markets and 53 languages.” turn financial results into engaging content that impresses and excites audiences. Today, many brands are adopting similar creative strategies, some even using best free AI tools for video creation to visually bring data to life in a more engaging and digestible way.
So, why not do the same? Publishing your financial and marketing results can be more than just a routine task—it can be a powerful marketing tool that strengthens your brand, attracts customers, and builds investor confidence. Consider using your reports as a way to tell your company’s success story.
Marketing Report Essentials
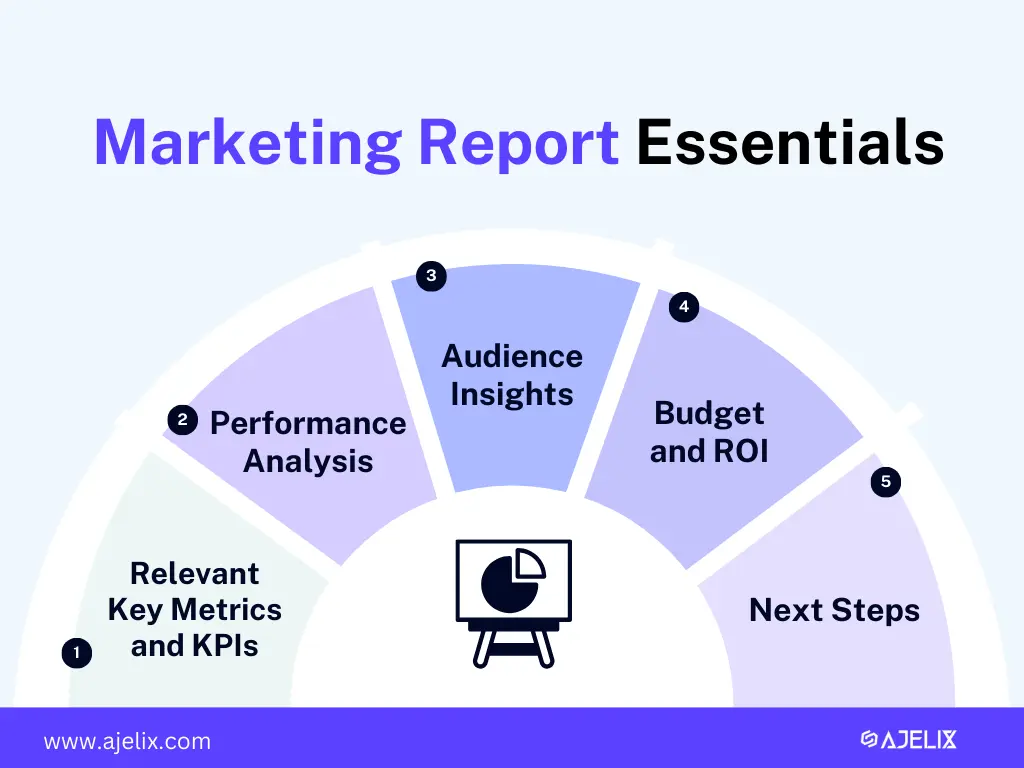
Key Metrics and KPIs
Focus on the most relevant metrics that align with your marketing goals, such as website traffic, conversion rates, social media engagement, or ROI. These help measure how well you’re achieving your objectives.
Out of ideas for KPIs? Get inspired by our 100+ KPIs for different business needs.
Performance Analysis
Analyze how each campaign or channel performed against your set goals. Highlight successes, challenges, and areas for improvement, and use visuals like charts or graphs to make it clearer.
Audience Insights
Include data about who your audience is and how they’re engaging with your marketing efforts. Understanding customer behavior helps improve targeting and achieve marketing goals more effectively.
Struggling with manual calculations & tiring setups?
Let agentic AI do the heavy lifting.
Start free
Fast sign up & easy setup
Budget and ROI
Show how much was spent on marketing efforts and the return generated. This helps assess whether you’re meeting your financial goals and maximizing your resources.
Recommendations and Next Steps
Conclude with actionable insights based on the data. Suggest improvements or new strategies to help meet future goals and drive better results in upcoming campaigns.
Turning insights into action often requires channel expertise and execution across paid, social, content, and SEO. If you’re looking for a partner to interpret your marketing reports, align KPIs with broader business goals, and deploy data-driven campaigns, consider partnering with a full-service digital marketing team in Chicago that can translate dashboards into measurable growth. They can audit your data, prioritize high-ROI opportunities, and run continuous testing so each report cycle informs smarter next steps.
Chief Marketing Officer Report Example
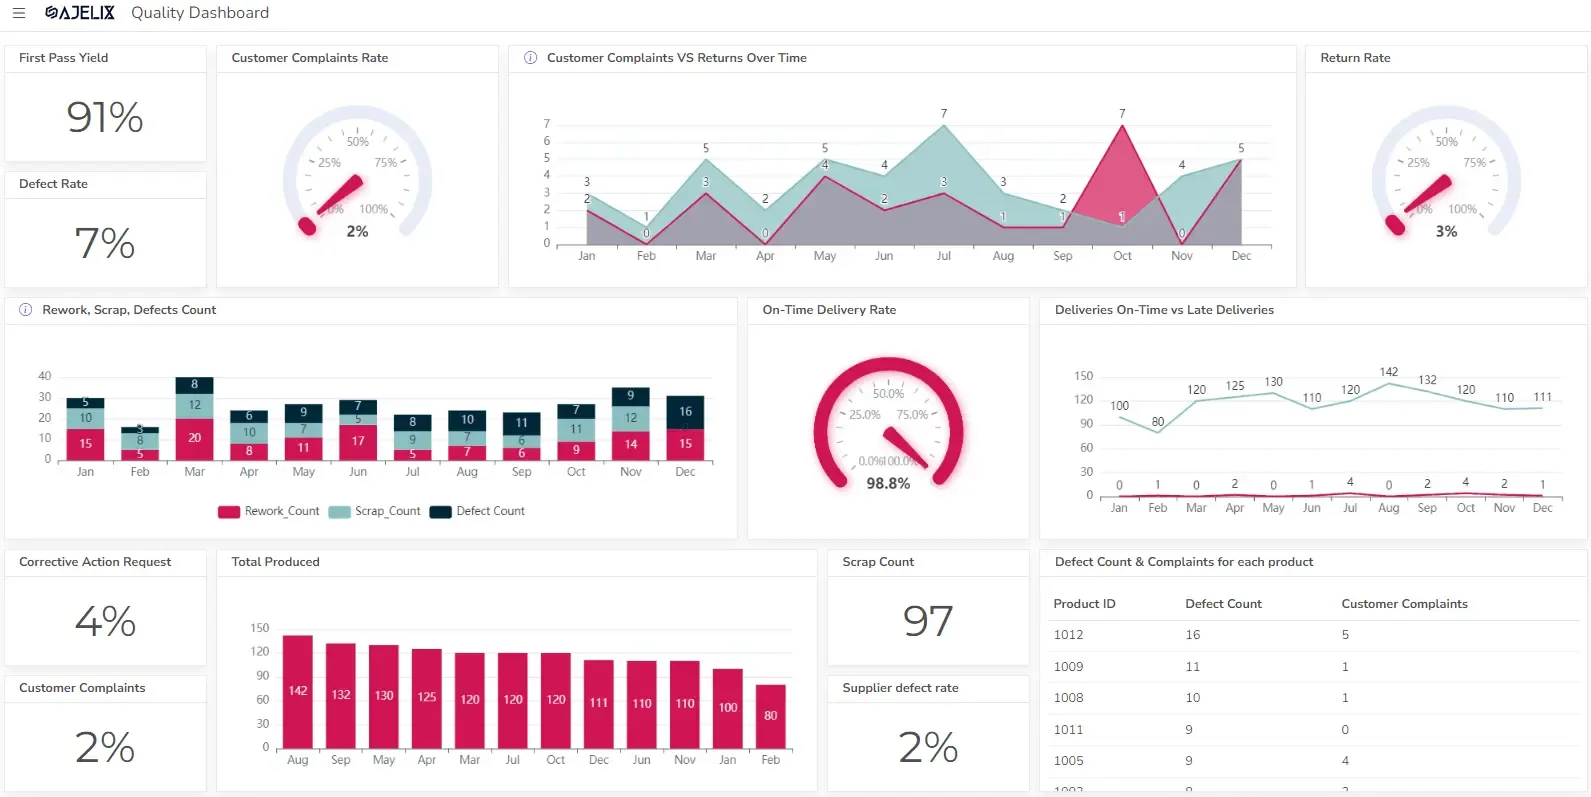
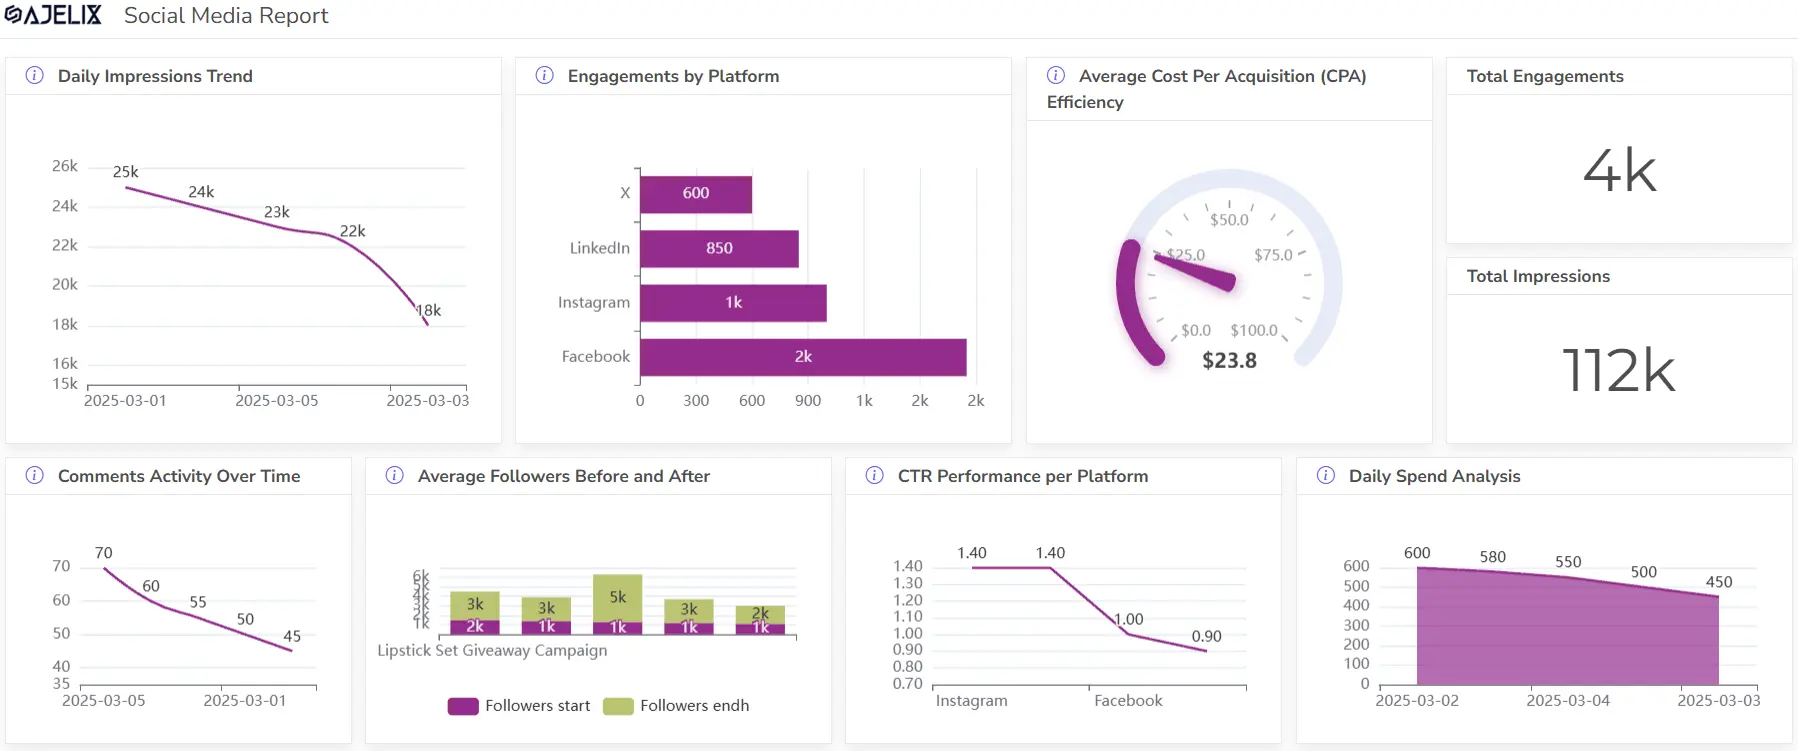
Let’s look at an example of a marketing report created by the Chief Marketing Officer from Company “X”.
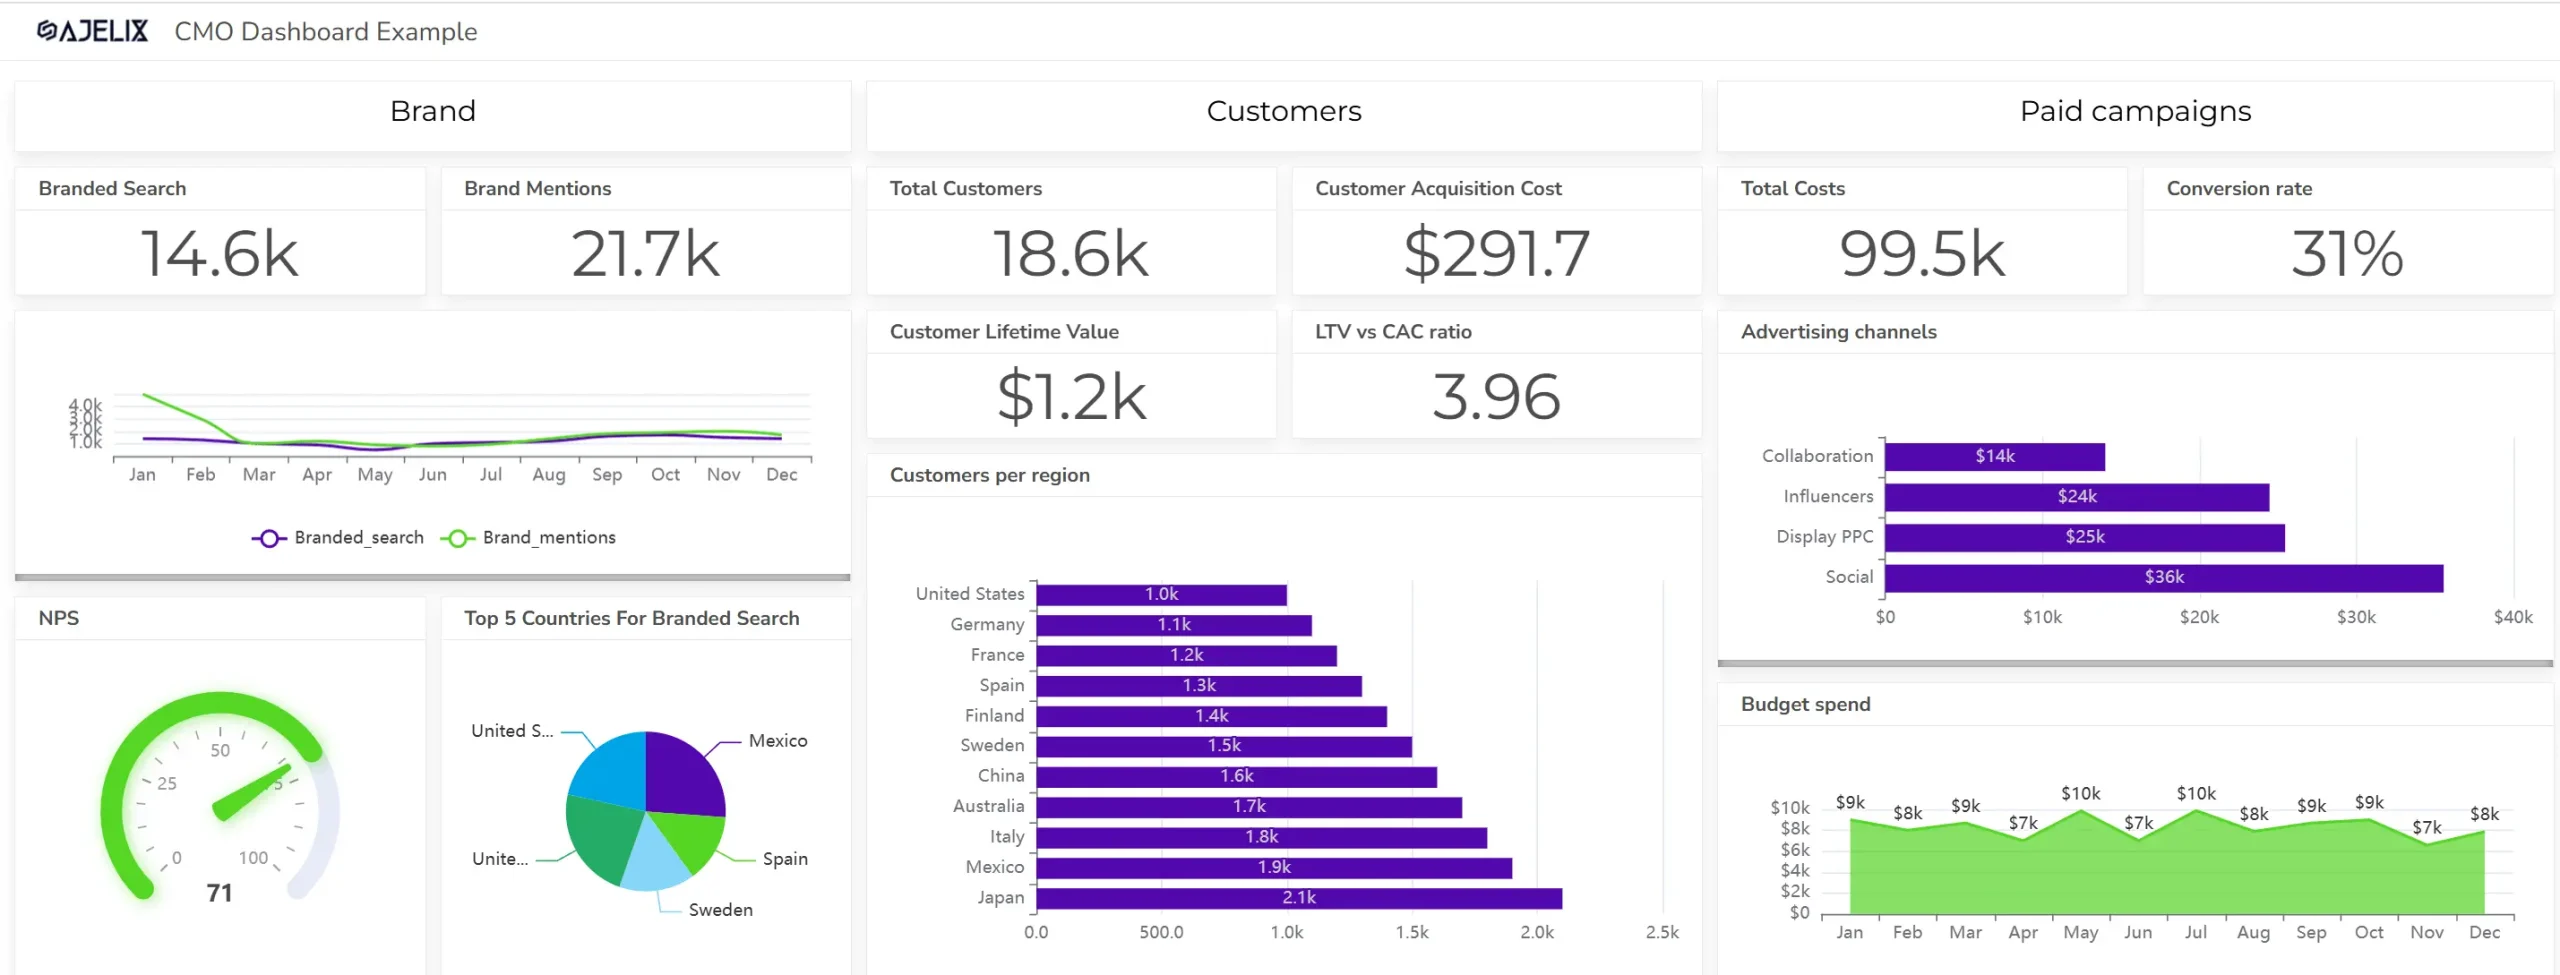
Analyzing this data is quite straightforward, isn’t it? The visualization presents key metrics like branded search, conversion rate, NPS, and other performance indicators in a clear and concise way.
This Chief Marketing Officer’s report shows 14.6k branded searches and 21.7k brand mentions—strong indicators of brand awareness. It also highlights a healthy customer acquisition cost of $291.7 and a solid conversion rate of 31%, reflecting effective advertising and customer engagement strategies.
Even without knowing the exact marketing goals, it’s clear that these results point to a successful marketing performance.
How to Create a Marketing Report in Ajelix BI?
When creating a marketing report (or any kind of data visualization really), we always rely on Ajelix BI. It speeds up the process by quickly analyzing data and providing real-time insights, making it faster and more efficient than doing it manually.
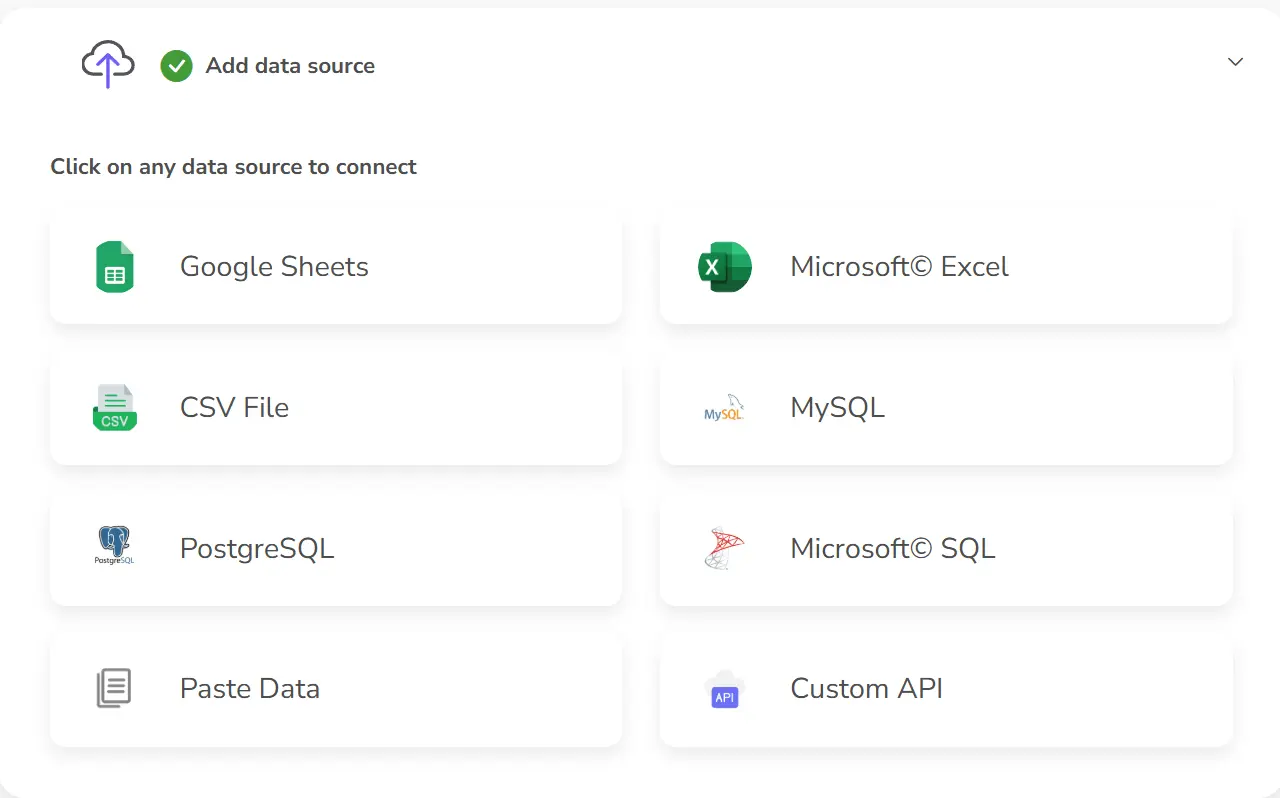
- Upload Your Marketing Data Into the Platform by Selecting Your Data Source
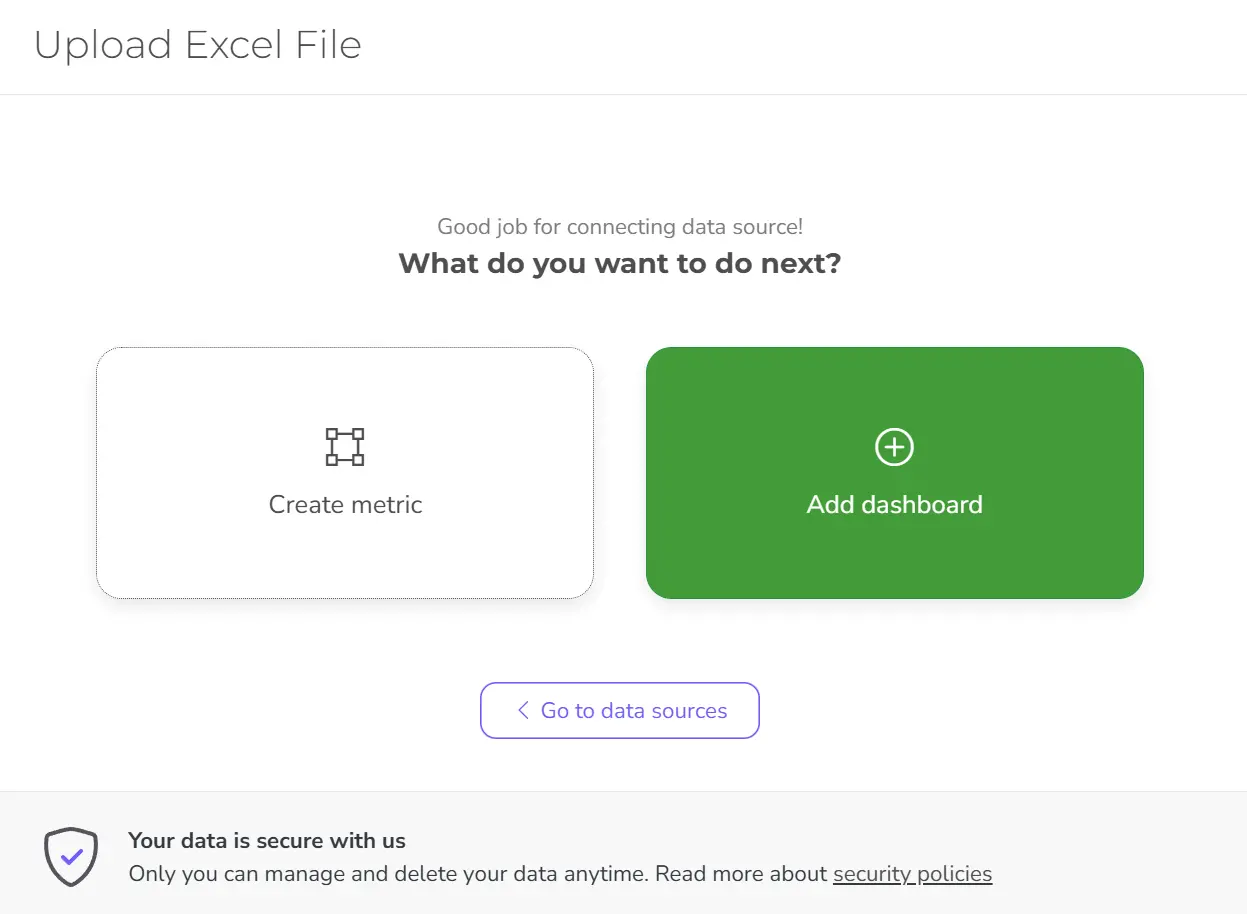
- After Data Upload, click on Add Dashboard
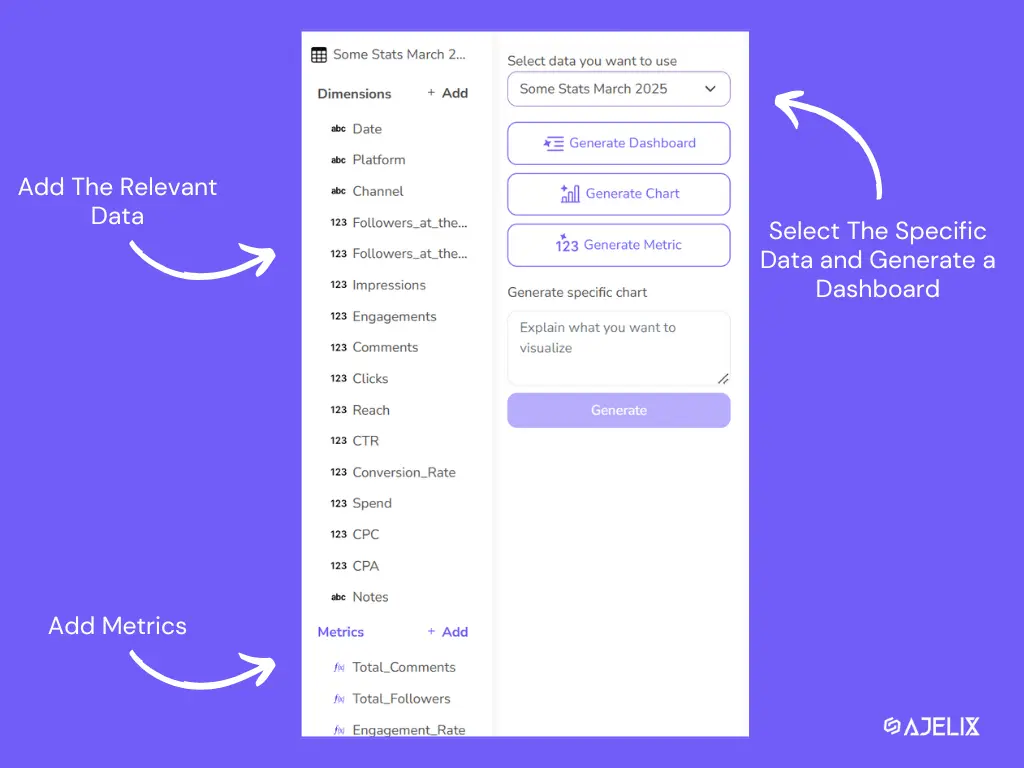
- Select the Correct Data Source and then Generate a Dashboard. Add Metrics, if needed.
Tip: You can add basic metrics directly from the Add Metric Option. If you plan on adding more advanced metrics, use the Data Prep Tool (detailed description here)
- Customize the Marketing Report with Your Brand Colors.
Common Mistakes to Avoid in Your Marketing Report
Creating marketing reports can be a game-changer, but once you make a few common mistakes, the impact of your report can drop quickly. Let’s explore 5 common report-making mistakes, so you can avoid them.
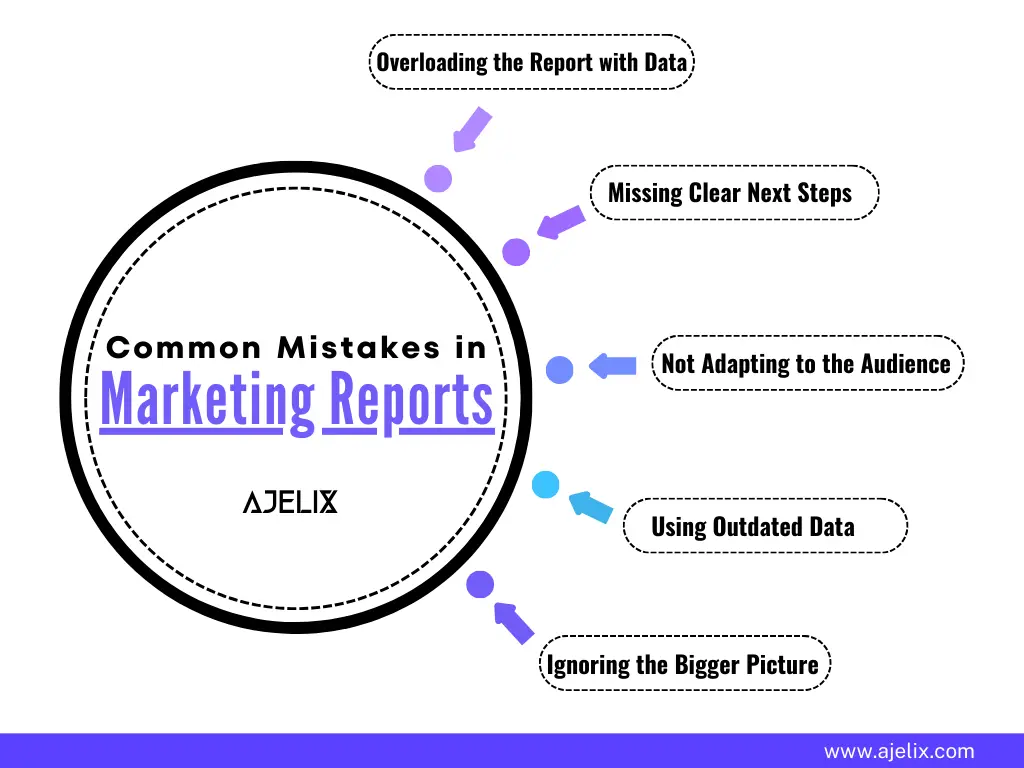
1. Overloading the Report with Data
Including too much data in a report can overwhelm the reader and make it difficult to find key insights. Instead, focus on the most relevant metrics that directly tie to your objectives, and present them in a clear, digestible way.
2. Missing Clear Next Steps
Just showing numbers isn’t enough, your report should help guide decisions. Always translate the data into actionable recommendations that your team can follow to improve results.
3. Not Adapting the Report for the Audience
A report that isn’t tailored to its audience won’t be effective. Adjust the level of detail and focus depending on whether you’re presenting an executive summary or more detailed reports to marketing teams or clients.
Executives may be more interested in high-level KPIs and ROI, while marketing teams may want detailed data on campaign performance and specific metrics.
4. Using Irrelevant Data
Relying on inaccurate or outdated data can lead to misguided decisions. Always make sure your data is up-to-date, properly sourced, and free from errors to maintain the integrity and reliability of your reports.
5. Ignoring the Bigger Picture
Focusing only on isolated metrics can lead to a skewed view of performance. Always tie the data back to overall business goals or long-term strategy to show the full impact of your marketing efforts.
Conclusion
To sum it up, marketing reports are your must-have for making smarter, data-driven decisions. Whether it’s advertising reports, social media marketing reports, or other marketing reports examples, these insights reveal not only what’s working but also where you can improve.
In case you find it challenging and time-consuming to make a report, remember that our BI platform, specially designed for non-techies, can always help you out!
Ultimately, a good marketing report is more than a summary. We’d say it’s like a roadmap that helps you take action and drive growth. And if it’s a strong roadmap, why keep it to yourself? Take inspiration from major brands like Spotify and Apple by sharing your results with your audience.
Want to stay in the deep research and tips loop? Sure, let’s stay connected.
FAQ
A marketing report is a data visualization that provides insights into the performance of your marketing efforts. It tracks key metrics, evaluates campaign results, and helps guide future strategies based on data analysis.
Marketing reports give you insights into what’s working and what isn’t, helping you make smarter decisions and optimize your marketing strategy for better results.
The most common reports are social media, advertising, email marketing, event marketing, and SEO reports, each focusing on different aspects like engagement, ad performance, conversions, or traffic.
Key metrics include website traffic, conversion rates, engagement, and ROI, all of which measure how well your campaigns are performing.
Avoid overloading the report with unnecessary data, missing actionable next steps, not adapting for your audience, using outdated data, and ignoring the broader business goals.
From data to report in one minute or less with Ajelix BI