- Home
- Product
- Tools
- AI Data Analyst
- Excel Formula Generator
- Excel Formula Explainer
- Google Apps Script Generator
- Excel VBA Script Explainer
- AI VBA Code Generator
- Excel VBA Code Optimizer
- Excel VBA Code Debugger
- Google Sheets Formula Generator
- Google Apps Script Explainer
- Google Sheets Formula Explainer
- Google Apps Script Optimizer
- Google Apps Script Debugger
- AI Excel Spreadsheet Generator
- AI Excel Assistant
- AI Graph Generator
- Pricing
AI Graph Generator
Create charts faster than ever by writing prompts to an online AI graph generator.
How can AI help you? Try AI Data Analytics platform with more than 15 AI tools including an AI dashboard generator for free ->
Our AI has helped more than 200 000+ people create professional reports faster.
Go unlimited 👇
An AI graph generator is a tool that uses artificial intelligence to create charts and graphs from your data and prompts. Imagine you tell the tool what you want the graph to show, and it creates the graph for you! AI chart generators can be much faster and easier to use than traditional graphing software.
What Is An AI Graph Generator?
An AI graph generator is a tool that uses artificial intelligence to create charts and graphs from your data automatically. Just feed it your information, and it will generate a visually appealing and informative representation of your findings.
What Are The Benefits Of Using AI Graph Generator?
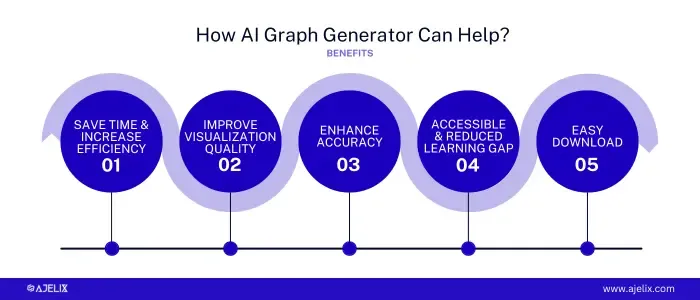
1. Increased Efficiency and Time Savings
AI automates the process of creating charts and graphs, freeing you up from tedious manual work. This can help you focus on analyzing the data and drawing insights.
2. Improved Visualization Quality
AI can generate visually appealing and clear graphs that effectively communicate trends and relationships within your data. Ajelix AI chart maker can even recommend the most suitable chart type for your data, ensuring optimal presentation.
3. Enhanced Accuracy
AI can reduce the risk of errors that can occur during manual data visualization. By automating the process, AI ensures consistency and adherence to best practices for data presentation.
4. Greater Accessibility
AI graph generators make data visualization accessible to a wider range of users, even those without prior experience in design or coding. With user-friendly interfaces, anyone can create clear and informative graphs to communicate their data.
5. Easy download
You can easily download high-quality images of your charts and add them to your presentation. Or you can build dashboards from your charts using AI dashboards.
6. Reduce Learning Gap
You don’t have to get special training or watch tutorials to build charts. Simply explain what you need in a plain prompt and get back chart.
Change the way you work with agentic AI
One-click dashboards,KPI tracking, and AI-powered insights—for work that actually gets done.
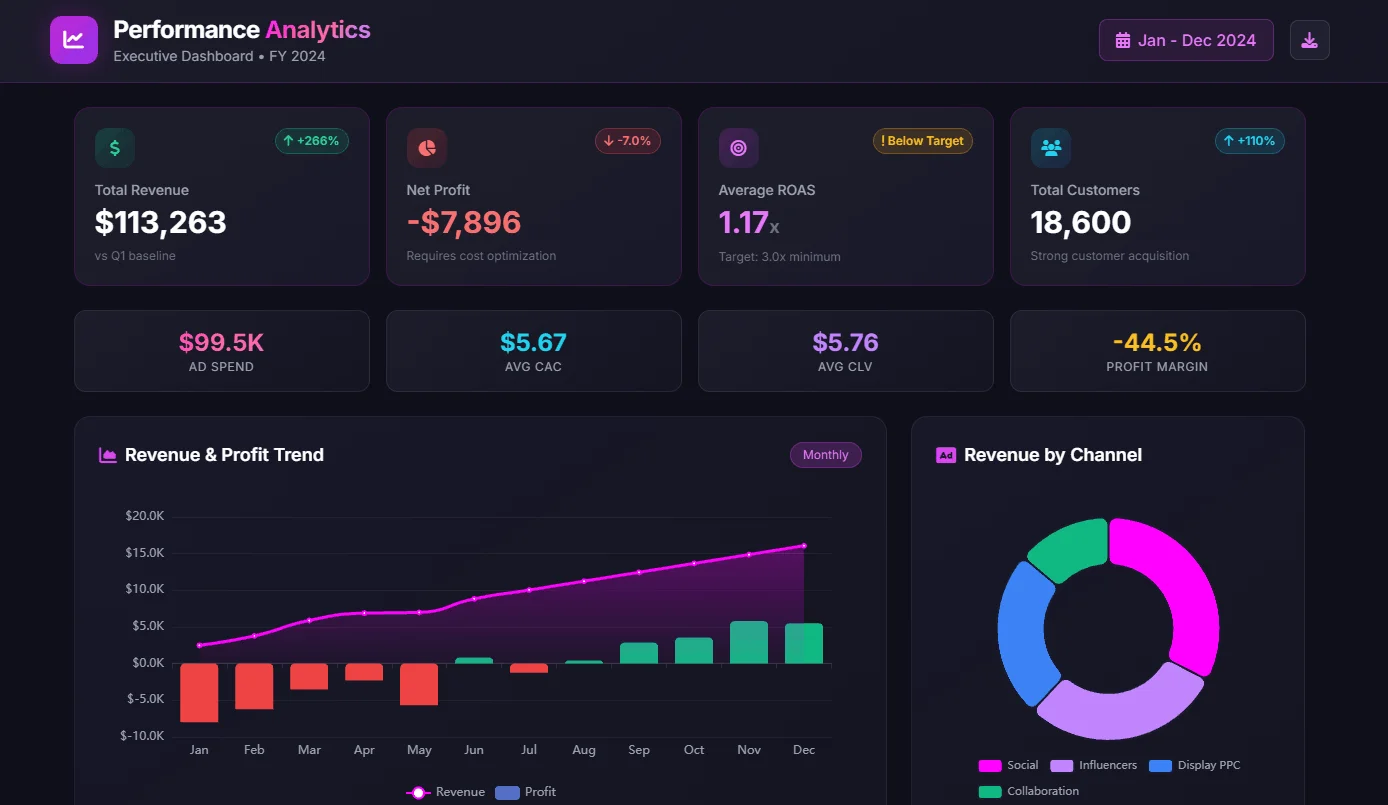
How To Use AI Graph Generator?
If you’re struggling to translate your data into clear and impactful visuals, then AI can help you. AI graph generators are revolutionizing data visualization by automatically creating charts and graphs from your information. This step-by-step guide will equip you to harness the power of AI and transform your data into compelling visuals, saving you time and effort.
1. Choose your AI Graph Generator
There are several AI graph generator tools available online, some free and some with paid plans. You can use the Ajelix chart generator that you can find at the top of this page.
2.Prepare your Data
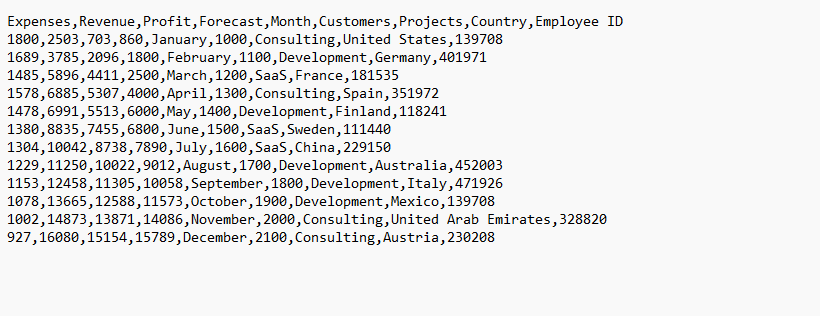
Ajelix AI graph generators work best with data in a structured format, like a .csv file. Ensure your data is clean and organized, with clear column headers representing the variables you want to visualize.
3. Upload or Connect your Data
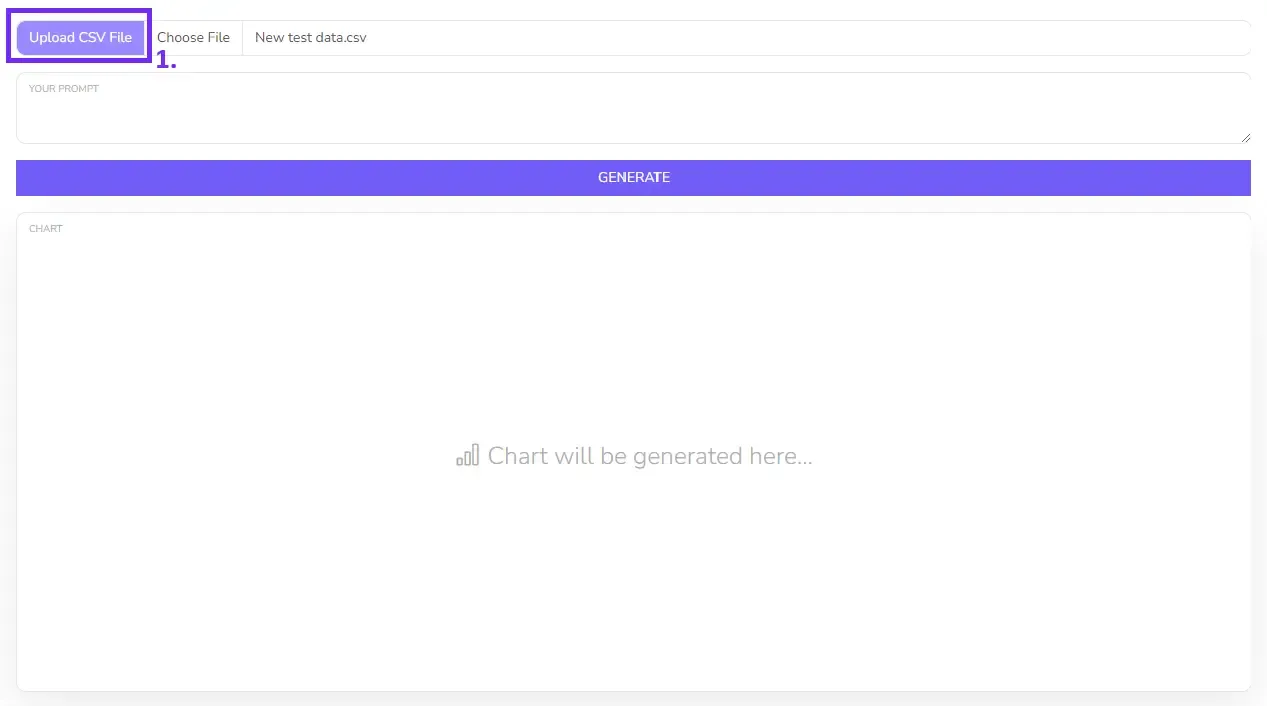
Click the Upload CSV file button and select the file from your computer storage. If you want to upload other files for AI chart generator, you can easily register and build these charts using Excel files, Google Sheets, or SQL connections.
4. Write A Prompt
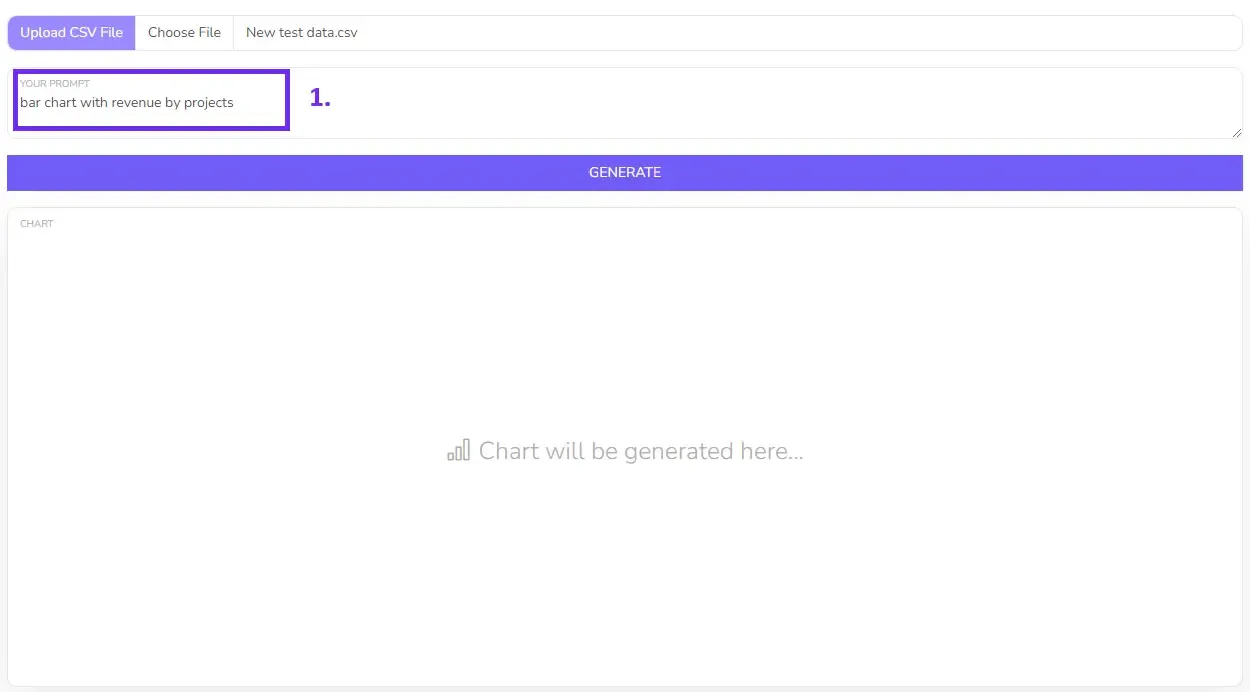
Provide a prompt specifying the type of graph you desire (bar chart, line chart, etc.) and how you want the data visualized (e.g., “Show me sales trends by region”). Indicate specific column names for precise results. This helps the AI tailor the output to your specific needs.
5. Generate your Graph
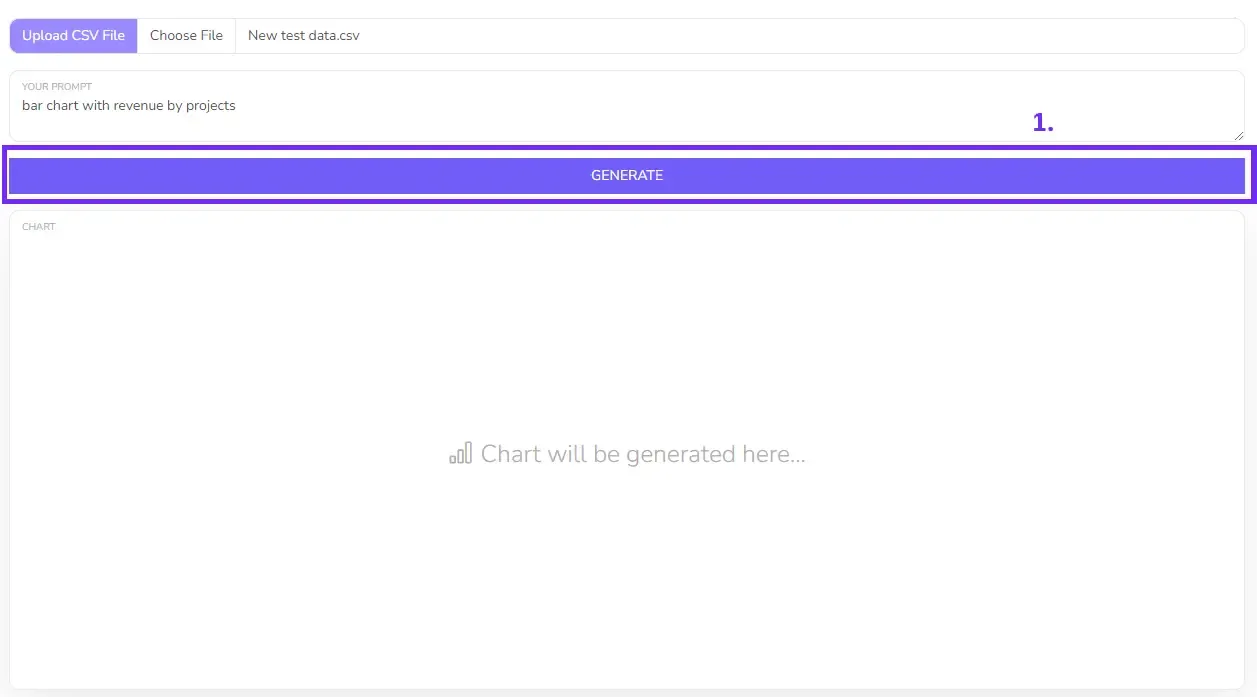
Once your data is loaded and any prompts are provided, simply initiate the generation process. The AI will analyze your data and create a corresponding graph.
6. Customize and Export
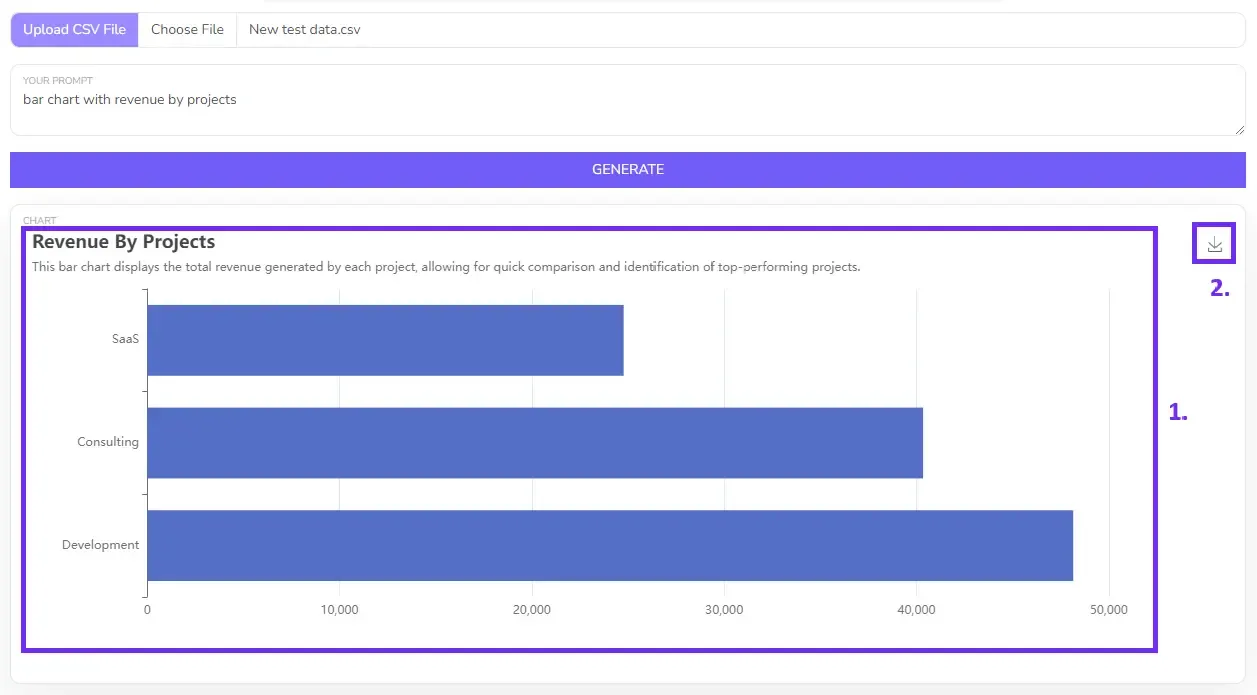
To customize the generated graph further, sign up on Ajelix for free. There you can change colors, and fonts, add labels, or edit chart elements to match your preferences. Finally, export the graph in a suitable format (image,) for sharing or including in reports. Or build sharable dashboards using a report-building platform.
Reporting gives you a headache?
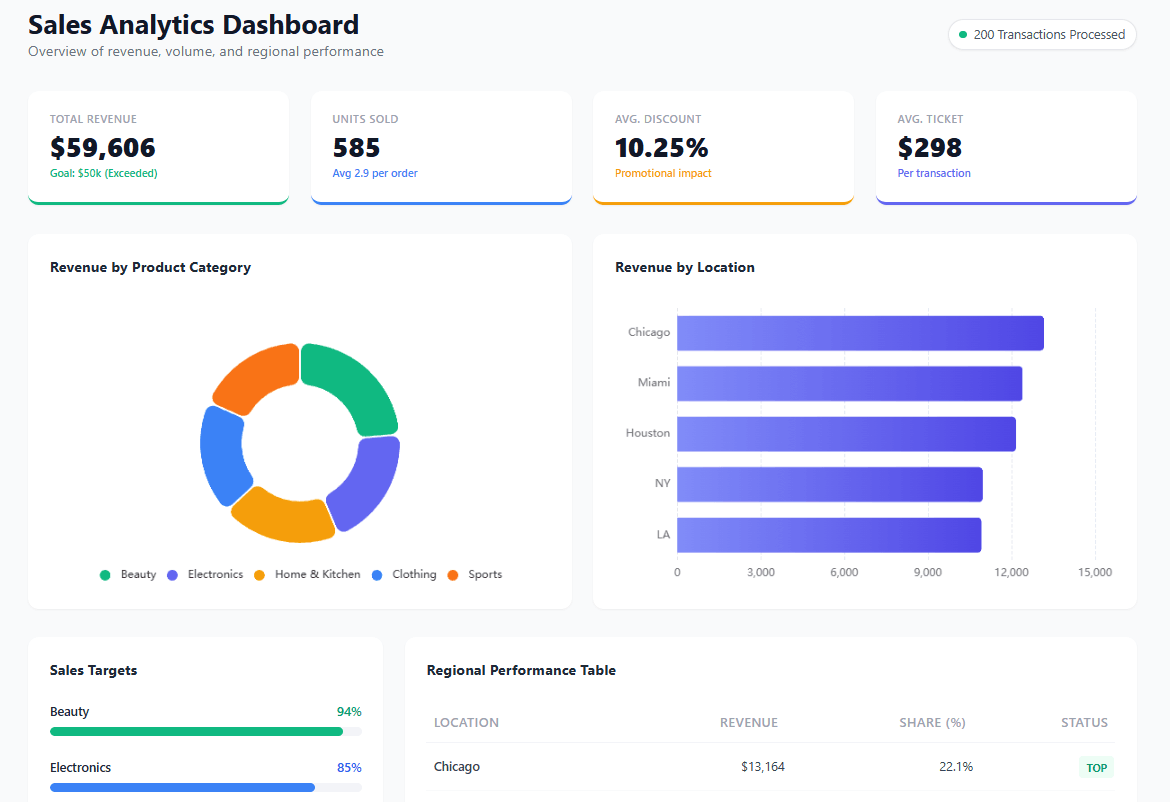
Upload your data and create professional reports with agentic AI
Start free
Try free and upgrade whenever
What Are The Limitations?
AI graph generators are transforming data analysis by automatically creating charts and graphs from your information. This table summarizes the key advantages and limitations to consider when using this technology:
| Feature | Benefit | Limitation |
|---|---|---|
Efficiency | Limited data understanding | Saves time by automating graph creation. |
Visualization Quality | Creates clear and appealing graphs | Relies on clean, high-quality data |
Accuracy | Reduces errors in manual data visualization | User interpretation is still necessary |
Accessibility | User-friendly for anyone to create graphs | Limited customization options |
AI graph generators offer a powerful tool to improve the efficiency and quality of your data visualization. By understanding the limitations and ensuring data quality, you can leverage AI to create impactful visuals that communicate your insights effectively.
For situations requiring highly specific customization or in-depth data understanding, data visualization tools might be preferable.
However, AI graph generators remain a valuable asset for anyone who wants to transform their data into clear and informative graphs.
FAQ
AI generators can create most common chart types like bar charts, line charts, pie charts, scatter plots, and histograms.
Yes, you can with an advanced AI chart generator that you can use by signing up on Ajelix. There you”ll be able to connect your Google Sheets or SQL server.
You can follow the Ajelix file formatting guides.
Yes, you can do that with an advanced AI chart generator by signing up on Ajelix.
Yes, we take user privacy seriously. Your queries and files are not stored or used for training machine learning algorithms. All queries are anonymous and are not used for other purposes. Check our privacy policy for details.
No, AI graph generators create visuals but human analysis is still needed to interpret the data and graphs.
Some popular AI graph generator tools include:
- Ajelix
- ChartAI
- GraphMaker
- Julius (paid)
- Venngage (with AI chart option)
- Piktochart (with AI chart option)
