How To Use AI In Excel: Top 5 Agentic AI Use Cases

You can use AI in Excel to generate templates, build financial models, create charts, produce dashboards, and convert spreadsheet data into presentations, all in minutes, not hours. Agentic AI doesn’t just assist you inside Excel; it does the work for you, from structure to formatting to formulas, so you go straight to the output.
In the video and guide, watch a full walkthrough of how to use AI in Excel to perform different tasks, from template creation to Excel file visualization.
Watch the Full Video
Why Most People Are Only Using Excel at 10% Capacity
Excel is one of the most powerful tools in business. It’s also one of the most underused because building anything meaningful in Excel takes time. Formulas, formatting, charts, financial models, templates, you can spend hours on setup before you even start analyzing a single number.
Learning how to use AI in Microsoft Excel spreadsheets changes that equation entirely. Instead of fighting the tool, you describe what you need, and an AI agent builds it. This guide breaks down the top five agentic AI use cases for Excel, pulled directly from real examples, so you can see exactly what’s possible and how fast it happens.
What Is Agentic AI for Excel?
Before diving into the use cases, it helps to understand the distinction. Using AI tools in Excel can mean anything from autocomplete suggestions to formula help. Agentic AI goes further, it reasons about the problem, makes structural decisions, executes multiple steps in sequence, and delivers a complete output. It’s not a copilot. It’s closer to handing a task to a skilled analyst and getting back a finished result.
This is what makes the use cases below different from simple AI assistance. Every example here is AI doing the work, not just helping you do it faster.
Top 5 Ways To Use AI in Excel
1. Generate Custom Excel Templates From Scratch
The problem with free Excel templates: they’re generic. Wrong structure, wrong categories, wrong formulas. You end up spending more time fixing someone else’s template than building your own.
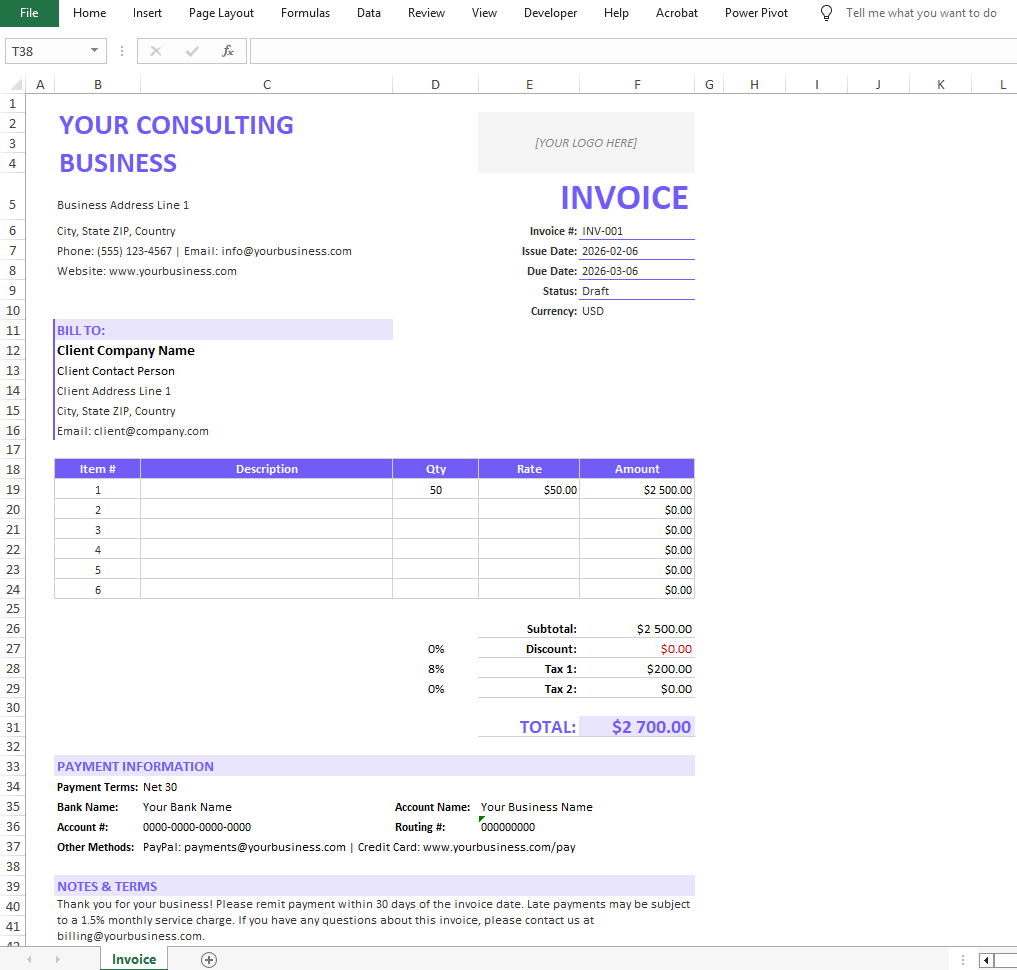
When you use AI to generate a template, you describe exactly what you need and the agent builds to your specifications. In the example from the video, the prompt was to create an invoice template for a consulting business with automatic tax calculations, subtotals, payment terms, and brand colors. The agent built the complete structure: line items, quantities, rates, automatic calculations, and professional formatting. No Googling, no formula troubleshooting, no adjusting a template that was 80% right.
Here’s the invoice template AI generated 👇
Here’s the prompt we used:
Create a reusable, modern Excel invoice template for a consulting business with automated calculations for taxes, discounts, subtotals, and totals. Include client and business information sections, invoice numbering, issue and due dates, payment terms, flexible line items, multiple tax rates, currency support, and a clear financial summary. Add invoice status tracking, payment instructions, notes and terms, and protect calculation cells for reliability. The design should be sleek, professional, print- and PDF-ready, and visually impressive while remaining intuitive and easy to customize.
You can even download the Excel template we generated in the video
This works for any template type: invoices, budgets, project trackers, inventory sheets, HR onboarding checklists, and client reports. Describe it once, get a production-ready file.
2. Build Financial Models With Investor-Grade Analysis
Financial modeling is one of the most time-intensive tasks in Excel. Revenue projections, expense forecasts, cash flow analysis, scenario planning, each one is a web of interconnected formulas. Building it correctly takes hours. Formatting it takes more.
This is one of the clearest demonstrations of how to use AI in Excel for data analysis at a professional level. The prompt in the video asked for a sales financial model with investor-grade analysis, dynamic charts, clear breakdowns, and multiple financial modeling perspectives. The agent didn’t fill in a template, it made decisions about structure, formula logic, and what a complete model requires.
The generated Excel file 👇
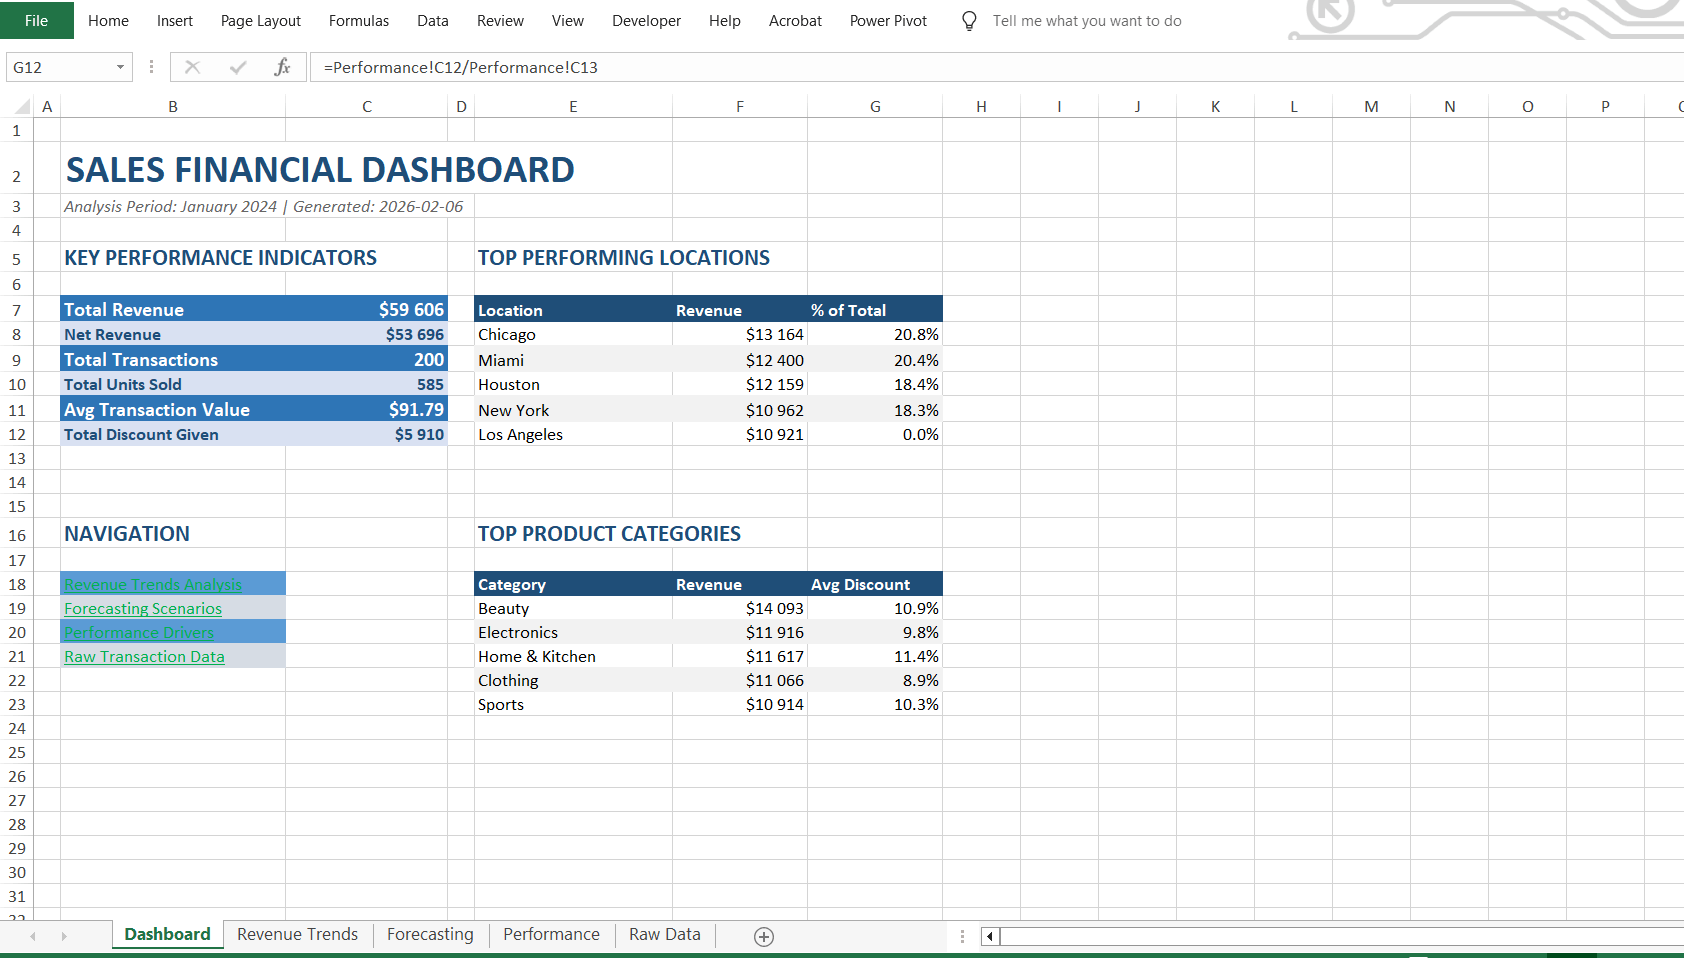
The output included:
- A summary dashboard
- Revenue trend sheets with forecasting models
- Conservative and optimistic projections
- A 12-month revenue forecast
- Performance breakdowns by location and product category
The entire process took around 15 minutes. That’s the difference between AI assistance and agentic AI, it didn’t help build the model, it built the model for me. We covered this in a video on our YouTube channel and an article on financial modelling with Agentic AI.
3. Create Charts and Data Visualizations Inside Excel
Here’s where most people lose time with Excel charts: the data is never the hard part. The hard part is chart type selection, color schemes, axis labels, formatting, and making it look like something you’d actually put in a presentation.
When you use AI to analyze data in Excel and generate visualizations, the agent handles all of those decisions for you. In the video example, a sales dataset was uploaded, and the AI was asked to create a complete sales dashboard with regional breakdowns and monthly trends. The agent didn’t default to bar charts for everything, it selected a line chart for trends and a bar chart for regional breakdown because those were the right choices for the data.
Everything charts, KPIs, and formulas were dynamic. Brand colors were applied automatically. The output was a publication-ready charts in Excel that could be dropped directly into a report or presentation.
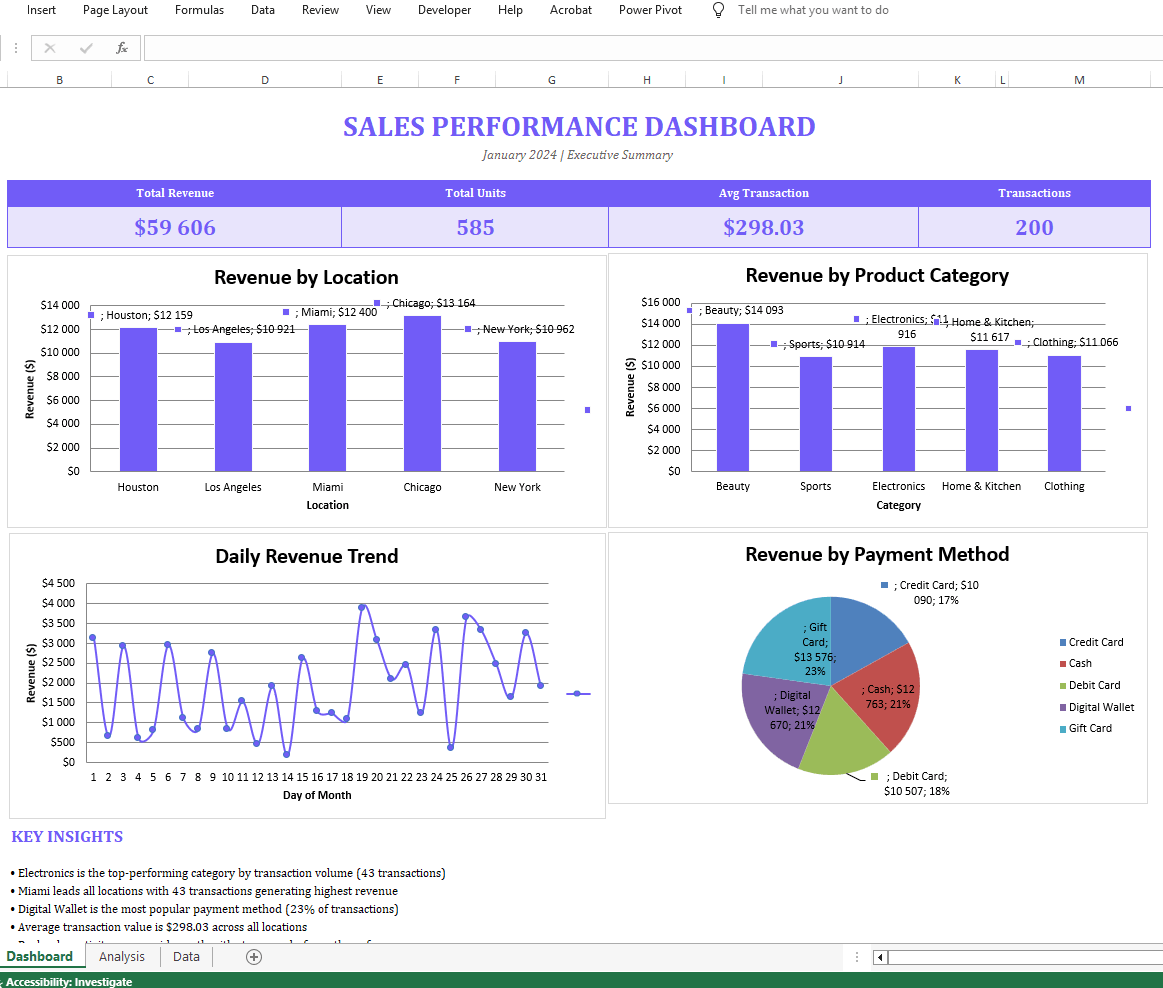
The time comparison: 45 minutes fighting Excel charts vs. 2 minutes reviewing what the agent created. We also did a video on this use case and article.
4. Generate Dashboards From Existing Excel, CSV, or Google Sheets Files
This use case is different from building charts from scratch. Here, you already have data in a full spreadsheet, possibly messy, maybe built by someone else, and you need to turn it into something readable at a glance that you can share with a board, stakeholders, or clients.
This is one of the most practical applications of AI for spreadsheet analysis at the business level. You don’t need to start fresh. You upload your file (or link your Google Sheet) and describe what you need.
In the video, the prompt asked for an executive-ready dashboard showing key metrics, performance trends, and actionable insights. What made this output notable was that the agent identified which metrics mattered to surface as KPIs, which to visualize as charts, and which to summarize in plain language. It didn’t just chart everything.
The result was a fully interactive dashboard that could be shared directly with stakeholders, embedded into web pages, or exported as a PDF, all through conversation with the agent.
Click here to add this dashboard to your workspace and further customize it.
Done manually, this is a half-day project. With agentic AI, it takes about five minutes. And that’s without needing to know Power BI or Tableau, because the output is already at that level.
The prompt we used:
I will provide a link to my Google Sheets file. Your task is to analyze the sales data and build a modern, interactive report with clear KPIs, filters, and actionable insights that can be easily shared with my boss and team. The report should be visually polished and executive-friendly with charts and cards, use our brand color (your-brand-color) consistently for accents and the color palette, and include our logo (your-logo-url) positioned at the top for branding. The final result should look professional, impressive, and ready for presentation.
We wrote an article on how to create a dashboard from any data source, and we also have a video on this use case.
5. Turn Excel Data Into a Finished PowerPoint Presentation
This is the use case that most people don’t see coming, and the one that tends to get the strongest reaction.
Every analyst, finance professional, and founder hits the same wall: I have all this Excel data. Now I need to present it to someone. The transition from spreadsheet to presentation is where hours disappear. Copy-pasting charts into PowerPoint, rebuilding layouts, writing the narrative around the numbers, it’s a full production process on top of the analysis work.
Agentic AI chatbot handles the entire transition with one prompt. In the video, the request was to create an investor-ready PowerPoint pitch deck from Excel data, structured to clearly communicate the problem, solution, product, and value. The agent pulled the relevant data, selected the right charts, built a slide deck with proper narrative flow, wrote the context and commentary for each slide, and formatted everything consistently.
The output wasn’t a rough layout. It was a complete, structured presentation ready to review and present, not rebuild. Here’s the entire video:
From Excel data to finished PowerPoint with one prompt. This is what learning how to use AI in Microsoft Excel looks like at its highest leverage.
Summary: 5 Agentic AI Use Cases for Excel
| Use Case | What AI Does | Time Saved |
|---|---|---|
| Custom Templates | Builds to your exact specs | Hours → Minutes |
| Financial Models | Full model with forecasting + scenarios | Hours → ~15 min |
| Charts & Visualizations | Selects chart types, formats, applies branding | 45 min → 2 min |
| Dashboards from Existing Files | Identifies key metrics, builds interactive dashboard | Half day → 5 min |
| Excel to PowerPoint | Pulls data, writes narrative, formats slides | Hours → One prompt |
How To Get Started With AI in Excel
If you’re ready to apply these use cases, the tool used in all of the examples above is available at chat.ajelix.com with a free trial. You don’t need GPT for work setups, complex integrations, or prior experience building models. You describe what you need, and the agent handles the execution.
For anyone looking to learn Excel with AI or move from manual spreadsheet work to agentic workflows, these five use cases are the starting point, not the ceiling. The same approach extends to generating landing pages, building applications, and producing full reports from raw data.
Final Thought
The use of Excel in data analysis hasn’t changed, what’s changed is how much of it you have to do manually. Every use case in this guide used to require technical skill, time, and patience. With agentic AI, the requirement is a clear description of what you want.
The hours are still there in the output. You’re just not the one spending them anymore.
New use cases are published weekly. Subscribe to stay updated as agentic AI workflows expand across industries.
Agentic AI chat that helps you complete projects
AI for work that ingests, transforms, and delivers the exact deliverables your team needs, while you stay focused on strategy. No more chatting, agents can get the job done.