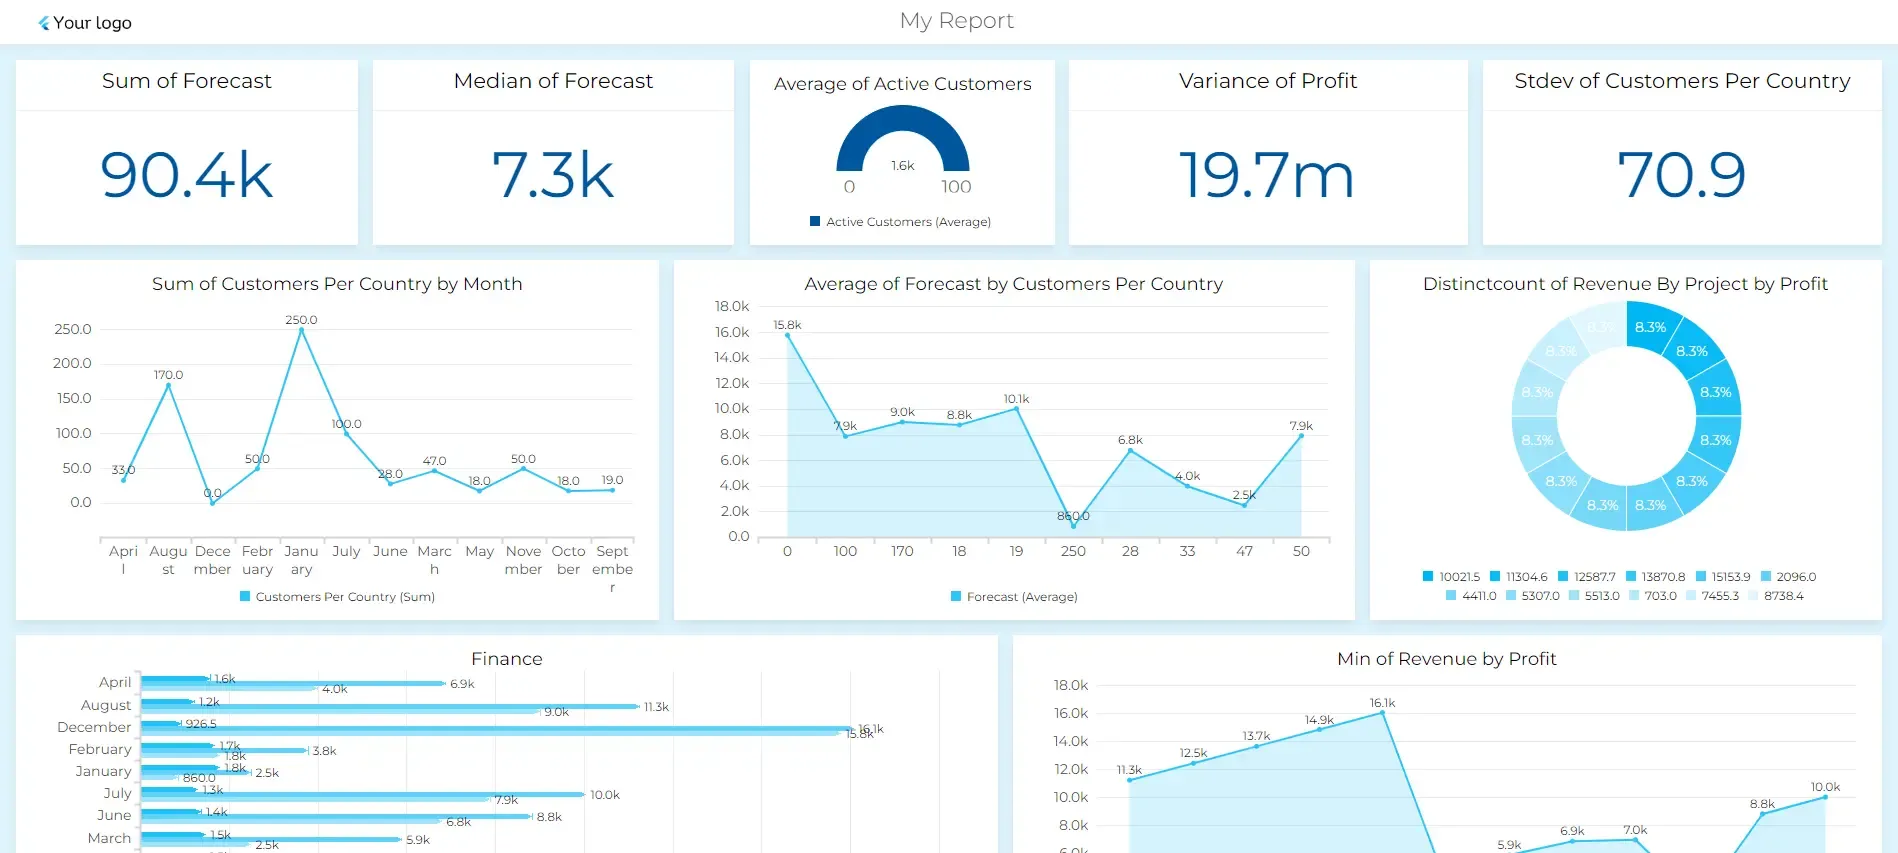
One-click reports and 1000’s of premade charts
Generate report from your data with one click automagically or choose from more than 1K premade charts with your data. Experience the ease of reporting with no-code editor.


No credit card requiered
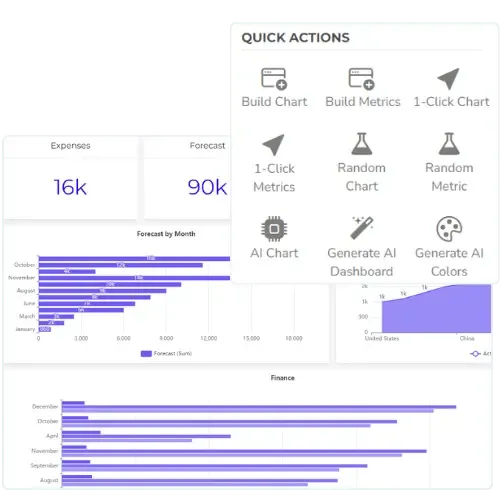
Quick action buttons for easier report building
- Generate dashboards using one-click button
- Choose from more than 1000 of premade charts and graphs with your data
- Add metrics with one click
- Build charts without any knowledge or training
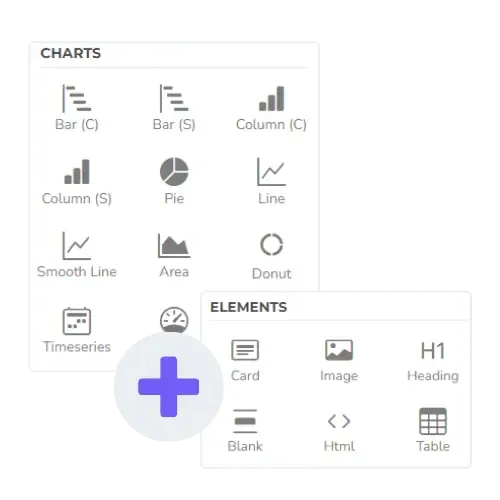
Charts & graphs for your data visualization needs
More than 24+ elements for efficient report building. But we’re not stopping there—with monthly updates our users can expect new elements any time soon.
- Choose from basic charts to more advanced visualizations
- Add elements, such as, tables, pictures and html to your reports
Customize dashboard to match it with your brand
- Upload your logo and make it shine on your data dashboard
- Set your brand colors and change background
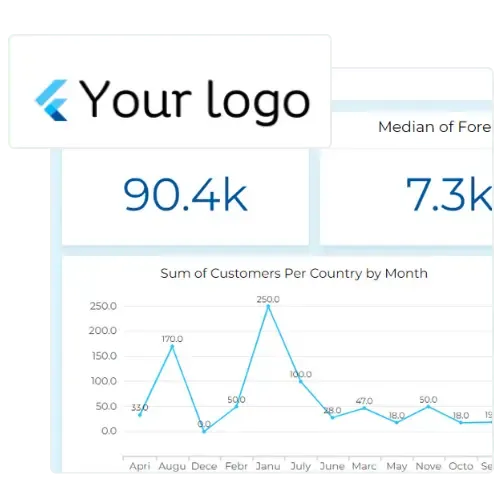
Customize your reporting process with Ajelix BI and see how easy it’s