- Home
- Data Visualization
- Tools
- AI Data Analyst
- Excel Formula Generator
- Excel Formula Explainer
- Google Apps Script Generator
- Excel VBA Script Explainer
- AI VBA Code Generator
- Excel VBA Code Optimizer
- Excel VBA Code Debugger
- Google Sheets Formula Generator
- Google Apps Script Explainer
- Google Sheets Formula Explainer
- Google Apps Script Optimizer
- Google Apps Script Debugger
- AI Excel Spreadsheet Generator
- AI Excel Assistant
- AI Graph Generator
- Pricing
- Resources
Explore other articles
- 7 Productivity Tools and AI Plugins for Excel
- Julius AI Alternatives: Top 5 Choices 2026
- No Code Analytics: Top Tools in 2026
- Automation Tools for Excel in 2026: Built-In & Third-Party
- 5 Healthcare Data Analytics Trends 2026
- Best Analytics Platform For Startups In 2026
- 15 Best AI Tools For Startups In 2026 We Tried
- 7 Best AI Tools for Excel Data Analysis (2026 Comparison)
- AI Data Intelligence For Workspace
- Conversational Analytics & AI
Try AI in Excel
We all know that Excel is known as the best tool for data analysis. The power of Excel is not only in its ability to perform complex calculations but also in its ability to save time and improve efficiency by helping you automate repetitive tasks.
If you work with Excel regularly, you know that efficiency is key. There are many ways to make your work in Excel more efficient, and we will share some of our favorites with you.
Looking to create reporting system fast & painlessly?
Build dashboards and track KPIs in one place with Ajelix BI

10 Tips to Improve Your Efficiency in Excel
Excel is a powerful tool that can be used to streamline your work. However, to truly maximize its potential, it’s essential to adopt efficient techniques. Here are 10 tips to help you improve your Excel efficiency:
1. Master Keyboard Shortcuts
Keyboard shortcuts can significantly speed up your workflow. Learn and practice essential keyboard shortcuts to navigate, edit, format, and use formulas more efficiently.
- Navigation: Ctrl+Home, Ctrl+End, Ctrl+Page Up/Down, Arrow keys
- Editing: Ctrl+X, Ctrl+C, Ctrl+V, Ctrl+Z, Ctrl+Y
- Formatting: Ctrl+B, Ctrl+I, Ctrl+U, Ctrl+Shift+>, Ctrl+Shift+<
- Formulas: Shift+F3, Alt+=
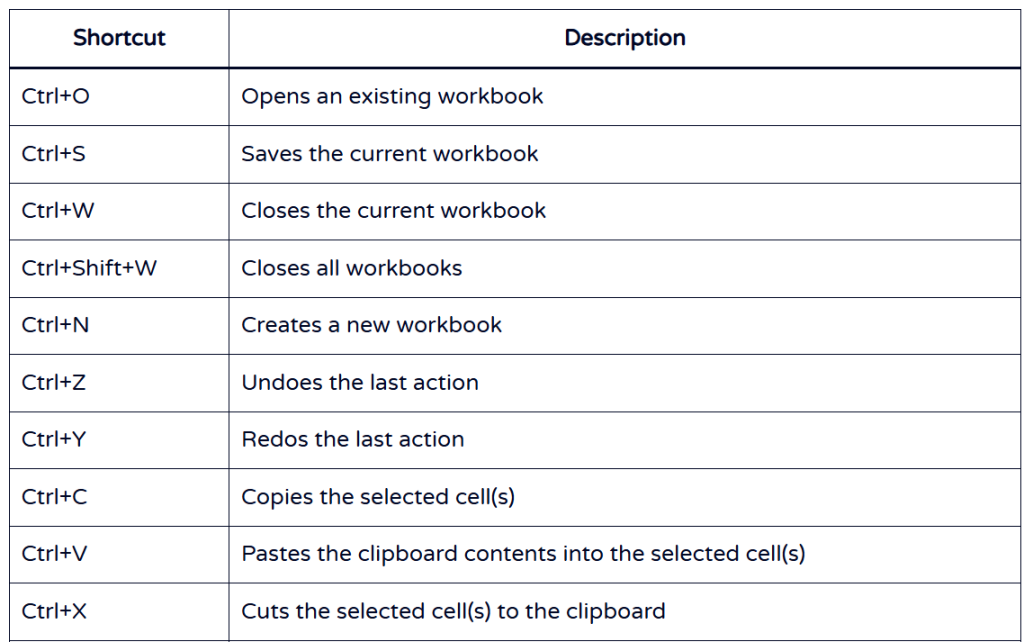
Explore more shortcuts in this article.
2. Use Built-in Functions
Excel offers a wide range of functions to automate calculations and data analysis. Some of the most commonly used functions include:
- SUM: Adds values
- AVERAGE: Calculates the average of values
- COUNT: Counts cells containing numbers
- IF: Performs logical tests
- VLOOKUP: Searches for specific values in a table
Learn and apply relevant functions to execute your calculations and data analysis. See other functions on our formula library.
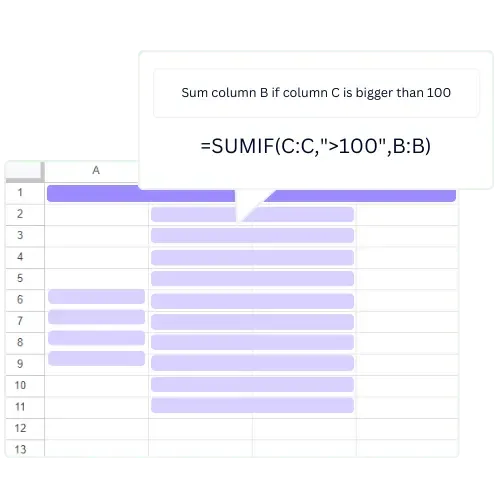
If you’re struggling with finding the right formula AI Excel Formula Generator can help you create the right formula. Just type in the formula requirements and AI will generate the formula for you.
Struggling with your Excel formulas?
Looking for a faster and easier way to write Excel formulas? Try AI Excel Formula Generator and turn your text into formulas with just a few clicks.
3. Utilize AutoFill
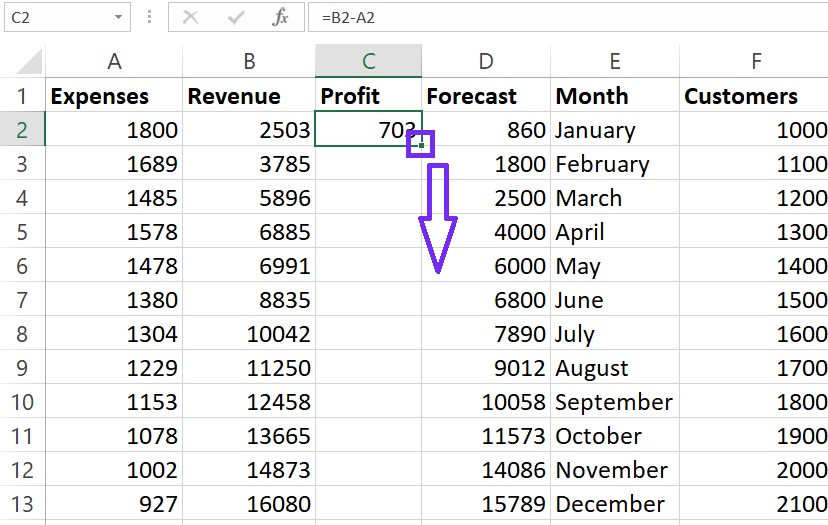
The AutoFill feature allows you to quickly copy formulas, formats, and data to adjacent cells. Simply select the cell with the desired content, and drag the fill handle (the small black square in the bottom right corner of the cell) to the desired range.
Here’s how to use it:
- Select the cell with the desired content.
- Drag the fill handle (small black square in the bottom right corner) to the desired range.
4. Conditional Formatting
Highlight specific cells or ranges based on certain criteria. This can help you quickly identify trends, outliers, or important data points.
Here’s how to apply it:
- Select the range of cells you want to format.
- Go to the “Home” tab and click “Conditional Formatting.”
- Choose a formatting rule from the options, such as “Highlight Cell Rules” or “New Rule.”
- Set the conditions for the formatting.
- Choose the desired format.
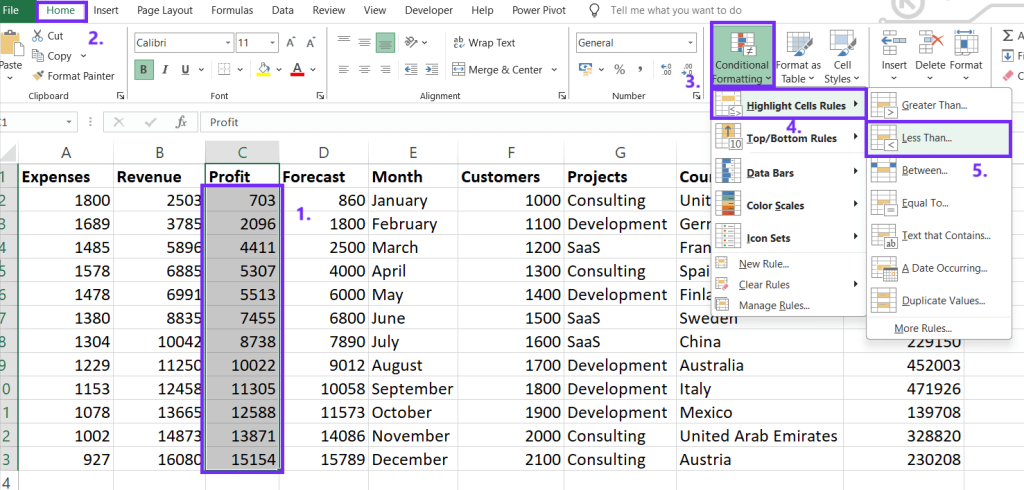
View our article on how to remove conditional formatting.
5. Data Validation
Control the type of data that can be entered into cells. This can prevent errors and ensure data consistency. Learn more on how to avoid errors and mistakes in worksheets using data validation.
Here’s how to do it:
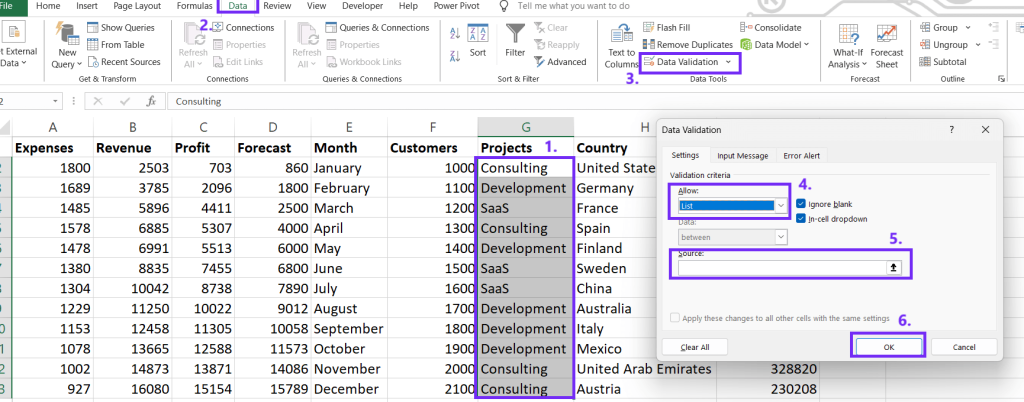
- Select the range of cells you want to validate.
- Go to the “Data” tab and click “Data Validation.”
- In the “Settings” tab, choose the validation criteria (e.g., number, text length, custom formula).
- Set the allowed values or range.
- Add an error alert message if needed.
6. Create Pivot Tables
Pivot tables are a powerful tool for analyzing large datasets. They allow you to summarize and group data in various ways.
Here’s how to insert one:
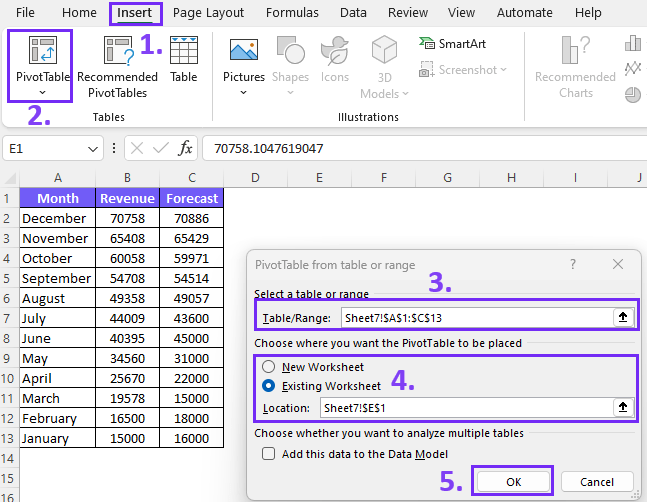
- Select the data range.
- Go to the “Insert” tab and click “PivotTable.”
- Choose the desired location for the PivotTable.
- Drag fields to the Rows, Columns, and Values areas to create the desired summary.
7. Use Power Query
Power Query is a data transformation tool that can help you clean, shape, and combine data from various sources.
Here’s how to use it:
- Go to the “Data” tab and click “Get & Transform Data.”
- Select the data source (e.g., Excel workbook, CSV file, database).
- Use the Power Query Editor to clean, transform, and combine data.
- Load the transformed data into your worksheet.
8. Learn to Use Relative and Absolute References
Understanding the difference between relative and absolute cell references is crucial for creating flexible formulas. Use the dollar sign ($) to lock a cell reference.
Relative Reference: Changes when the formula is copied to a different cell.
Absolute Reference: Remains fixed when the formula is copied.
- Use the dollar sign ($) to lock a cell reference.
- Example: $A$1 (locks both row and column), A$1 (locks row), $A1 (locks column).
9. Organize Your Worksheets
A well-organized worksheet is easier to read and understand. Use clear headings, formatting, and color-coding to improve readability.
- Use clear and concise labels.
- Format your data consistently.
- Use color-coding to highlight important information.
- Group related data together.
- Add comments to explain complex formulas or data.
10. Practice Regularly
The more you practice, the faster and more efficient you’ll become. Experiment with different techniques and find what works best for you.
- Experiment with different features and functions.
- Take online courses or tutorials.
- Join Excel forums and communities to learn from others.
- Practice regularly to improve your skills.
11. Macros
Use Macros to automate tasks in Excel. For example, you can use a macro to insert a row every time you enter a new customer’s information. Or, you can use a macro to automatically populate a worksheet with data from a database. Macros can save you a lot of time, and they’re relatively easy to create.
12. VBA
VBA stands for Visual Basic for Applications. It’s a programming language that you can use to create macros and custom functions. Use VBA to automate just about anything in Excel. Use our AI Excel Assistant to generate VBA scripts for a more productive workday.
FAQ
Relative references change when the formula is copied to a new cell and absolute references remain fixed when the formula is copied. Use the dollar sign ($) to lock a cell reference.
Power Query is a data transformation tool that allows you to clean, shape, and combine data from various sources.
Speed up your spreadsheet tasks with Ajelix AI in Excel
