- Home
- Data Visualization
- Tools
- Excel Formula GeneratorUnderstand Excel formulas in a fraction of the time.
- Excel Formula ExplainerUnderstand Excel formulas in seconds.
- Google Apps Script GeneratorGenerate script from requirements.
- Excel VBA Script ExplainerExplain Excel VBA code with AI.
- Excel VBA Script GeneratorGenerate VBA Scripts.
- Excel VBA Code Optimizer
- Excel VBA Code Debugger
- Google Sheets Formula GeneratorTranslate text into formulas.
- Google Apps Script ExplainerExplain scripts with AI.
- Google Sheets Formula ExplainerAnalyze and explain formulas.
- Google Apps Script Optimizer
- Google Apps Script Debugger
- Excel File TranslatorTranslate Excel files 10X faster.
- Formula And Script LibrarySave and collaborate formulas.
- Excel Template GeneratorCreate downloadable Excel file from keyword
- Excel Add-inUse our tools right into your sheet.
- Your Virtual AI Assistant For Excel SpreadsheetsGet advanced help with spreadsheets.
- Pricing
- Services
- Resources
-
What is VARP function in Excel?
The VARP function in Excel calculates the variance of a population of data points, which measures how spread out the data is from its mean value.
VARP Function Description
The VARP function in Excel is a statistical tool that can be used to calculate the variance of a population. It is an important function in statistical analysis, as it allows users to measure the amount of variation between the individual values of a sample set.
The function takes two arguments; a range of values or an array of values, and an optional argument that indicates whether to include the population (TRUE) or sample (FALSE) variance. When using the VARP function, the first argument is the range or array of values that need to be calculated. The second argument is an optional argument indicating whether to include the population or sample variance.
The function will return the population variance if the argument is TRUE and the sample variance if the argument is FALSE.
For example, if you have a list of scores in a range of cells, the function can be used to calculate the variance of the scores. This can be useful in determining the range of scores within a given sample set, and can be used to compare the variance between two different samples.
The function can also be used to calculate the variance between two different groups of data. For example, if you have a list of sales figures from different regions, the VARP formula can be used to calculate the variance between the sales figures from each region. This can be useful in determining how much variation there is between different regions.
Struggling with your Excel formulas?
Looking for a faster and easier way to write Excel formulas? Try AI Excel Formula Generator and turn your text into formulas with just a few clicks.
VARP Function Syntax
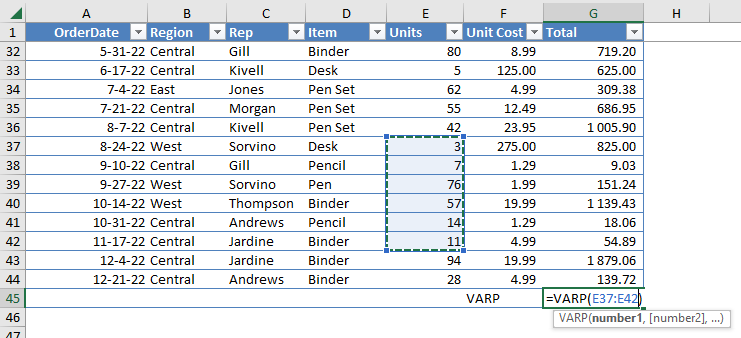
=VARP(number1, [number2], …)
This function returns the variance of a population based on the number of arguments provided. The arguments can be numbers, cell references, or ranges of cells.

How to use VARP function in your workbook:
- Open the Microsoft Excel spreadsheet that contains the data you want to calculate the variance for.
- Select the cell where you want the result of the variance calculation to appear.
- Enter the function “=VARP(“. Select the range of cells containing the data you want to calculate the variance for. Close the parentheses “)”.
- Press “Enter” to execute the function. The result of the variance calculation will appear in the selected cell.
Frequently Asked Questions
You can calculate variance in Excel by using the VARP function, which calculates the variance of a population. Here are the steps to follow:
- Select an empty cell where you want to display the variance result.
- Type “=VARP(” into the cell.
- Select the range of cells that contain the data for which you want to calculate the variance.
- Close the formula with a closing parenthesis “)” and press Enter.
VARP assumes you have the entire population of data. VAR.S (or VARA) is used for samples and estimates the variance of a larger population based on a subset of data.
VAR.S (or VARA): Use this for variance estimation based on a sample. VAR.P: This function (introduced in Excel 2010) offers similar functionality to VARP but might be more efficient for larger datasets.
Read latest blog articles about Excel
WEEKLY BLOG ARTICLES WITH INDUSTRY NEWS AND HELPFUL GUIDES


