How To Analyse Google Analytics Data With AI
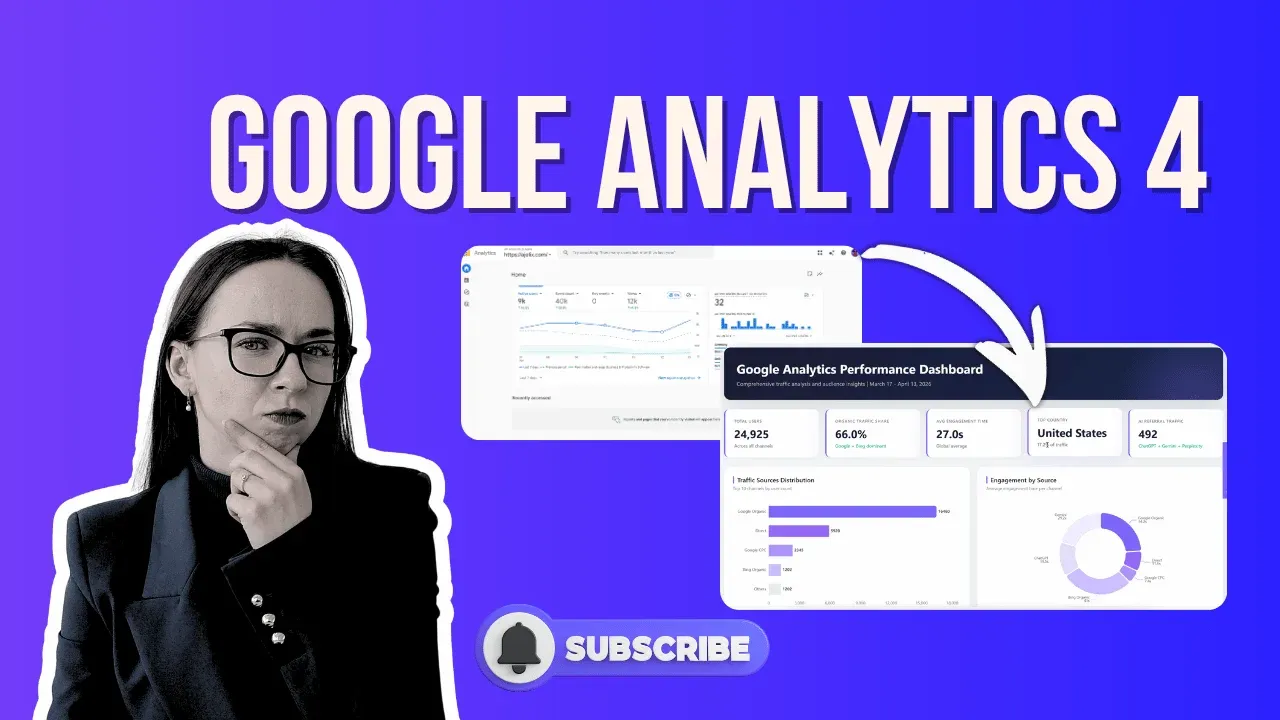
The fastest way to analyse Google Analytics data is to export three CSV reports from Google Analytics 4, user acquisition, landing pages, and demographics, upload them to an agentic AI tool, and ask the right question. In under five minutes, you get a complete Google Analytics dashboard with traffic breakdowns, engagement comparisons, geographic insights, and strategic recommendations.
That’s what this guide walks you through.
Watch the Full Video Walkthrough
Why Most Google Analytics Data Analysis Goes Nowhere
You open Google Analytics, stare at the numbers, and close the tab. Sound familiar?
Most website owners are sitting on months, sometimes years of Google Analytics 4 data, and have no idea what to do with it. The interface shows you what happened, but it doesn’t tell you what it means or what to do next. That’s the gap analytics intelligence reporting tools powered by AI are designed to close.
The goal isn’t to look at data. The goal is to grow the website.
What You’re Trying to Answer
Before touching any tools, get clear on the three questions that drive this entire workflow:
- Which channels bring the most traffic, and which ones have the best engagement quality?
- Which landing pages are performing, and which ones are quietly wasting traffic?
- Who is visiting your site, and are there high-engagement audience segments you’re completely ignoring?
These are the questions a proper Google Analytics data analysis workflow should answer and what we will cover in this guide.
How To Analyse Google Analytics Data With AI
1. Export Data From Google Analytics 4
This is the foundation. Here’s exactly how to check Google Analytics and pull the three files you need.
Export 1: User Acquisition (Source & Medium)
- Go to Reports in the left sidebar
- Click Acquisition → User Acquisition
- At the top, change the dimension filter from “Session default channel group” to First user source / medium
- Click Share this report → Download file → Download CSV
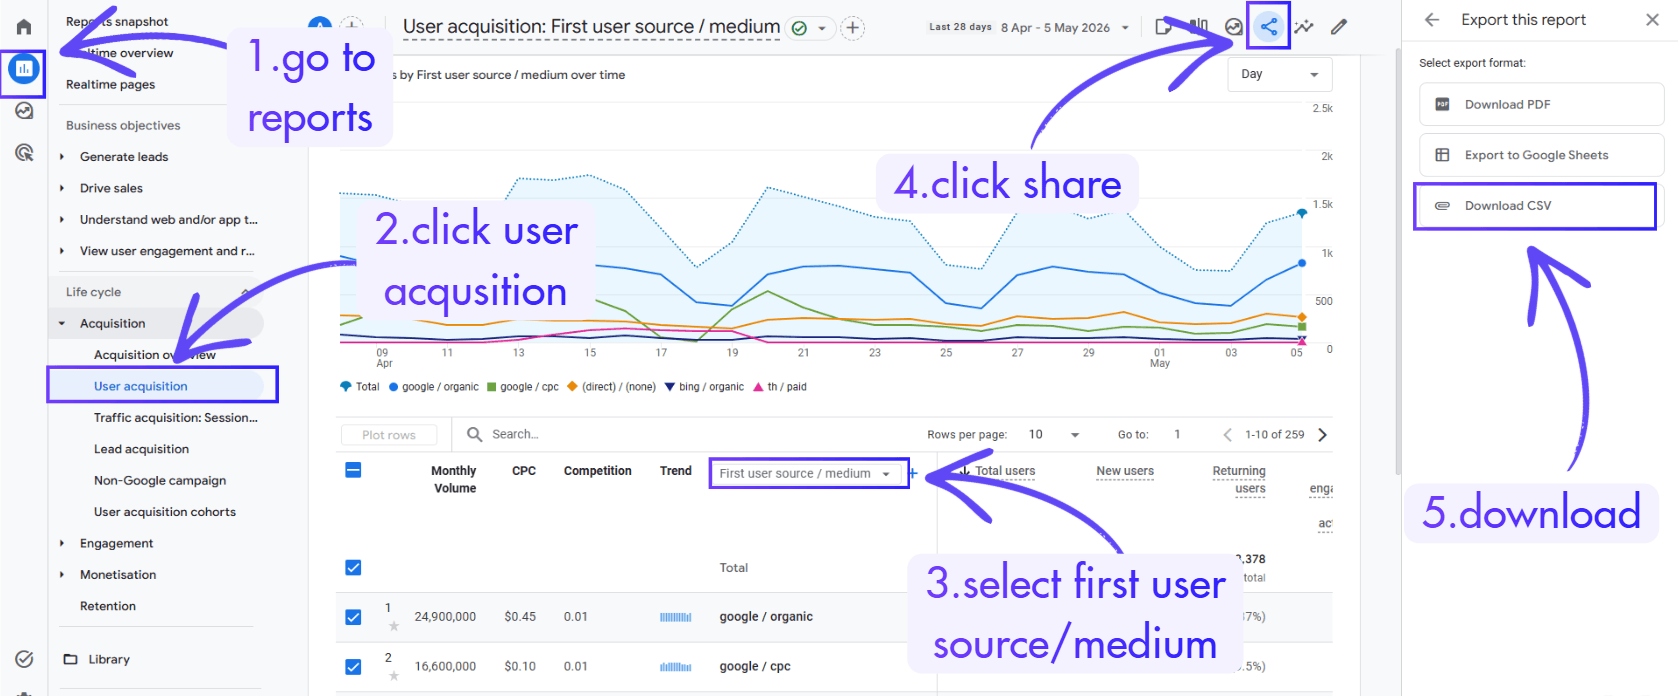
This gives you a granular breakdown of every traffic source driving sessions to your site — the raw material for proper data analysis in Google Analytics.
Export 2: Landing Page Performance
- Stay in Reports and go to Engagement → Landing Page
- Review metrics like engaged sessions and average engagement time per session
- Export as CSV using the same download method
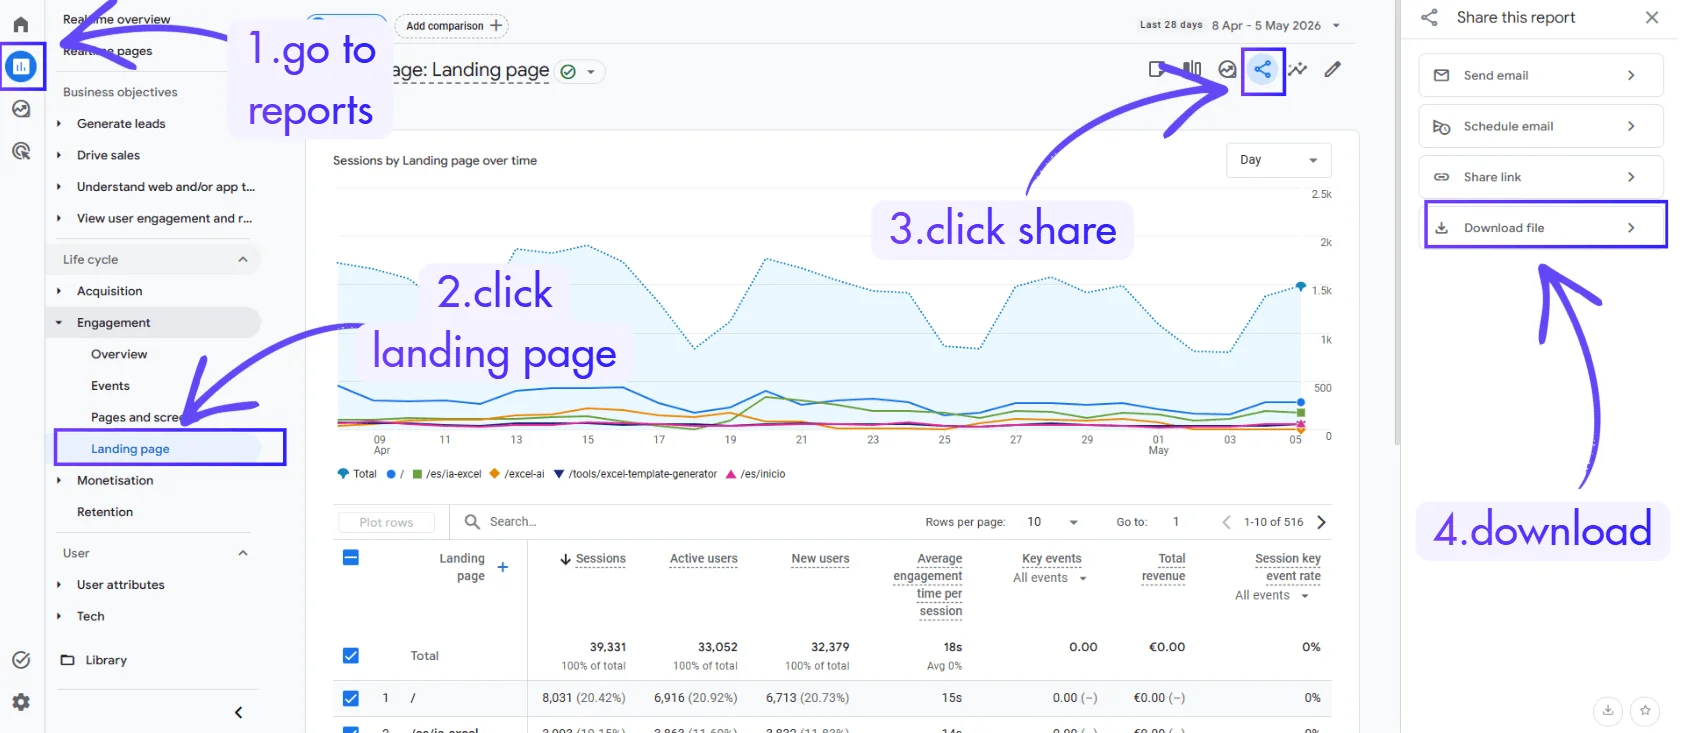
This report shows you which pages users land on first and, critically, whether they actually engage. It’s one of the most useful and most overlooked Google Analytics analysis tools built into the platform.
Export 3: Demographic Details
- Navigate to User → User Attributes → Demographic Details
- Review the country and audience overview
- Export as CSV
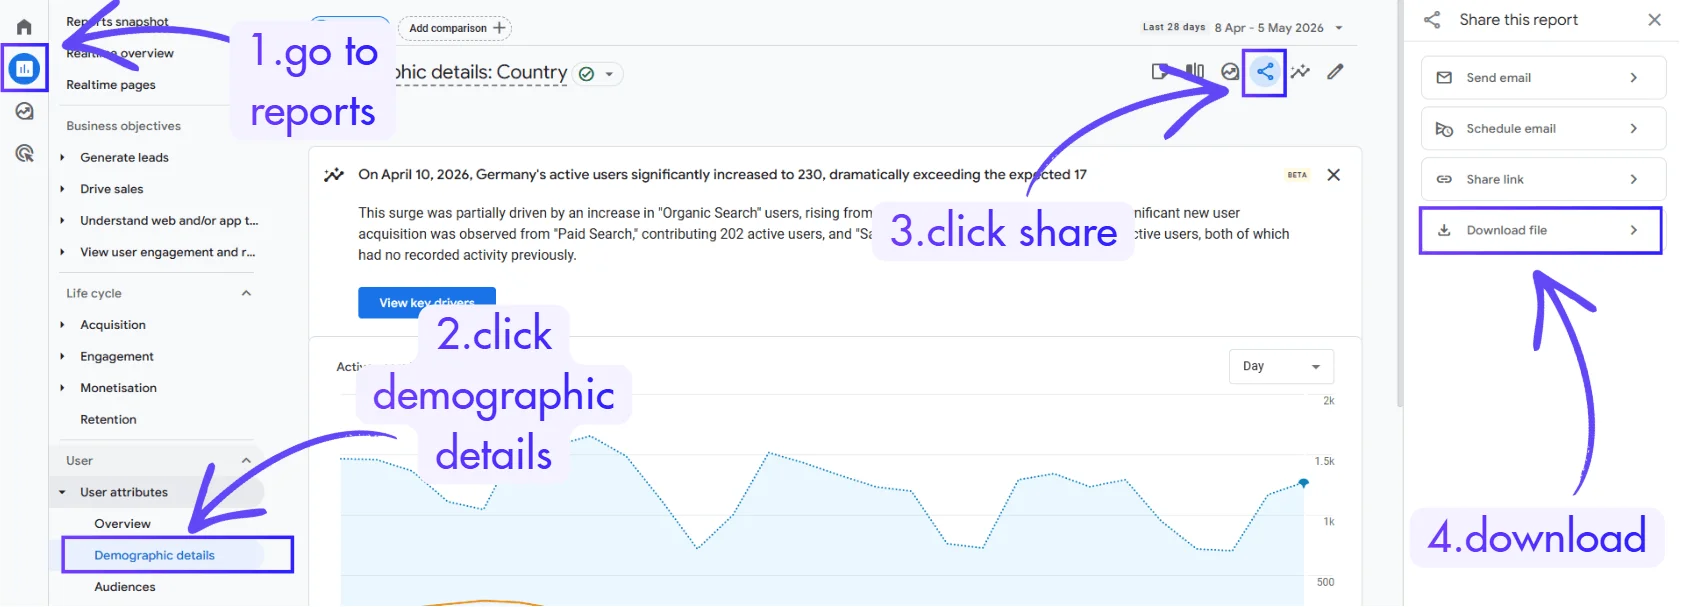
This is where insights from Google Analytics often hide. High-engagement markets you’ve never thought to target. Demographics that convert at rates the main view never surfaces.
Author’s note: Depending on your goals, you can pull additional exports e-commerce data, Search Console integration, event tracking. The same workflow handles all of it. But three files is more than enough to demonstrate how powerful this gets.
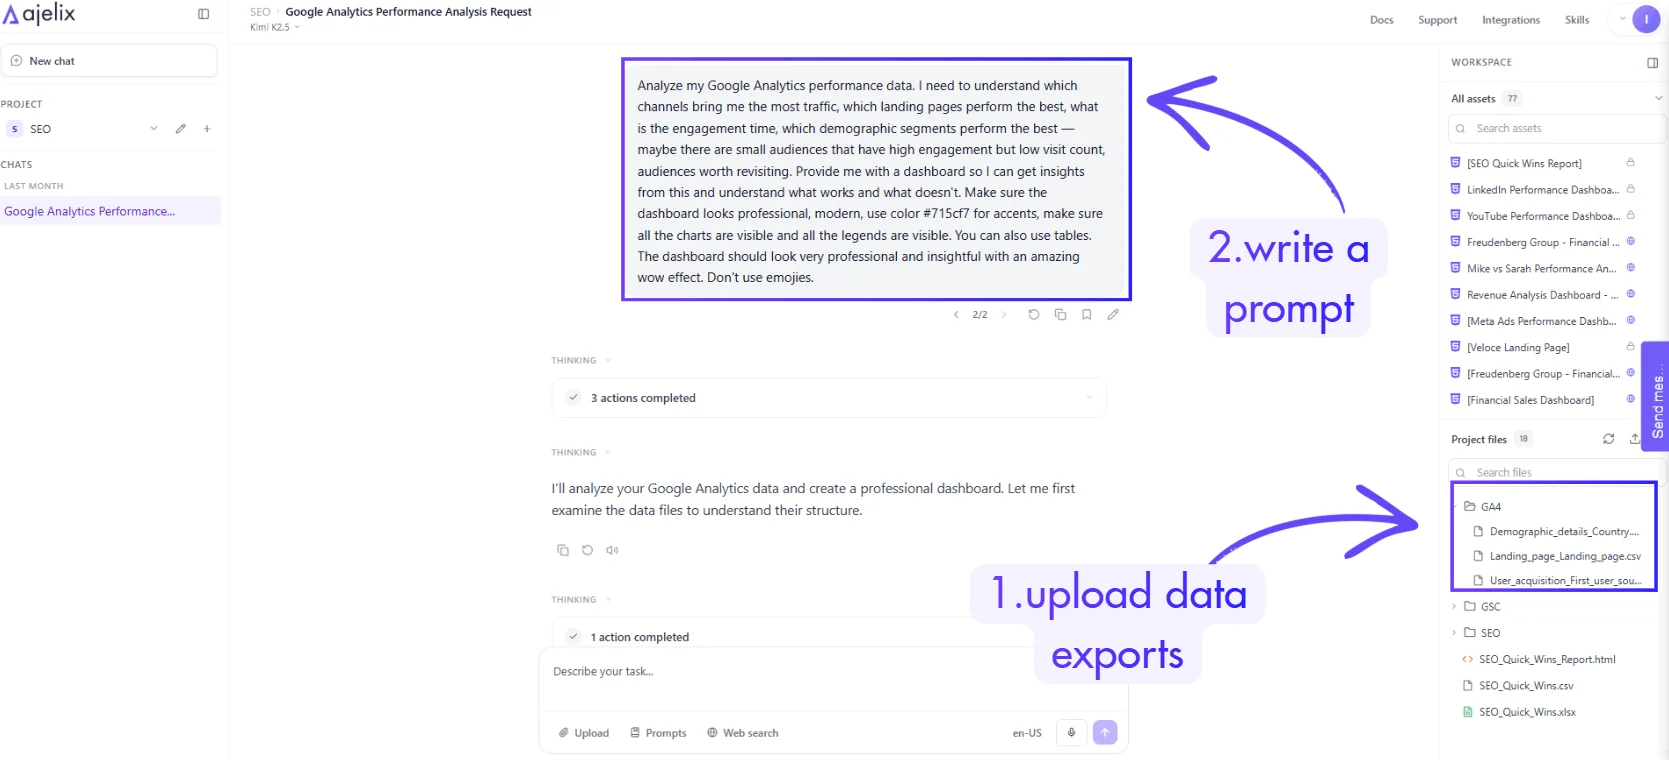
Step 2: Upload the Files to an AI Analysis Tool
Go to chat.ajelix.com, create a free account if you haven’t, it takes under a minute, no credit card required.
Once you’re in, create a new project (name it something like “Google Analytics 4 Analysis”) and upload all three CSV files. This is an agentic AI interface, meaning it doesn’t just answer questions, it takes action. It can analyze data, build visualizations, produce dashboards, and cross-reference multiple files simultaneously.
You can see this same approach applied across other data workflows, like YouTube analytics or HR reporting, where the same three-step pattern produces board-ready outputs.
Step 3: Write a Prompt That Gets Real Insights
This is the step most people skip or do wrong. Don’t ask for a summary. Tell the AI what decisions you’re trying to make.
Here’s the prompt structure that works:
“Analyze my Google Analytics performance data. I need to understand which channels bring me the most traffic, which landing pages perform the best, what is the engagement time, which demographic segments perform the best — maybe there are small audiences that have high engagement but low visit count, audiences worth revisiting. Provide me with a dashboard so I can get insights from this and understand what works and what doesn’t. Make sure the dashboard looks professional, modern, use color [your-color] for accents, make sure all the charts are visible and all the legends are visible. You can also use tables. The dashboard should look very professional and insightful with an amazing wow effect. Don’t use emojies.”
The specificity matters. When you frame the prompt around decisions, not just data, the AI’s output becomes directly actionable. This is what separates useful analytics intelligence reporting from a wall of numbers. If you want to go deeper on this approach, the how to use AI as a business analyst guide covers the prompting methodology in more detail.
Step 4: How To Interpret Google Analytics Reports With AI
Once the AI finishes reading and cross-referencing the files, you’ll get a dashboard with several layers of analysis. Here’s how to interpret Google Analytics reports produced this way:
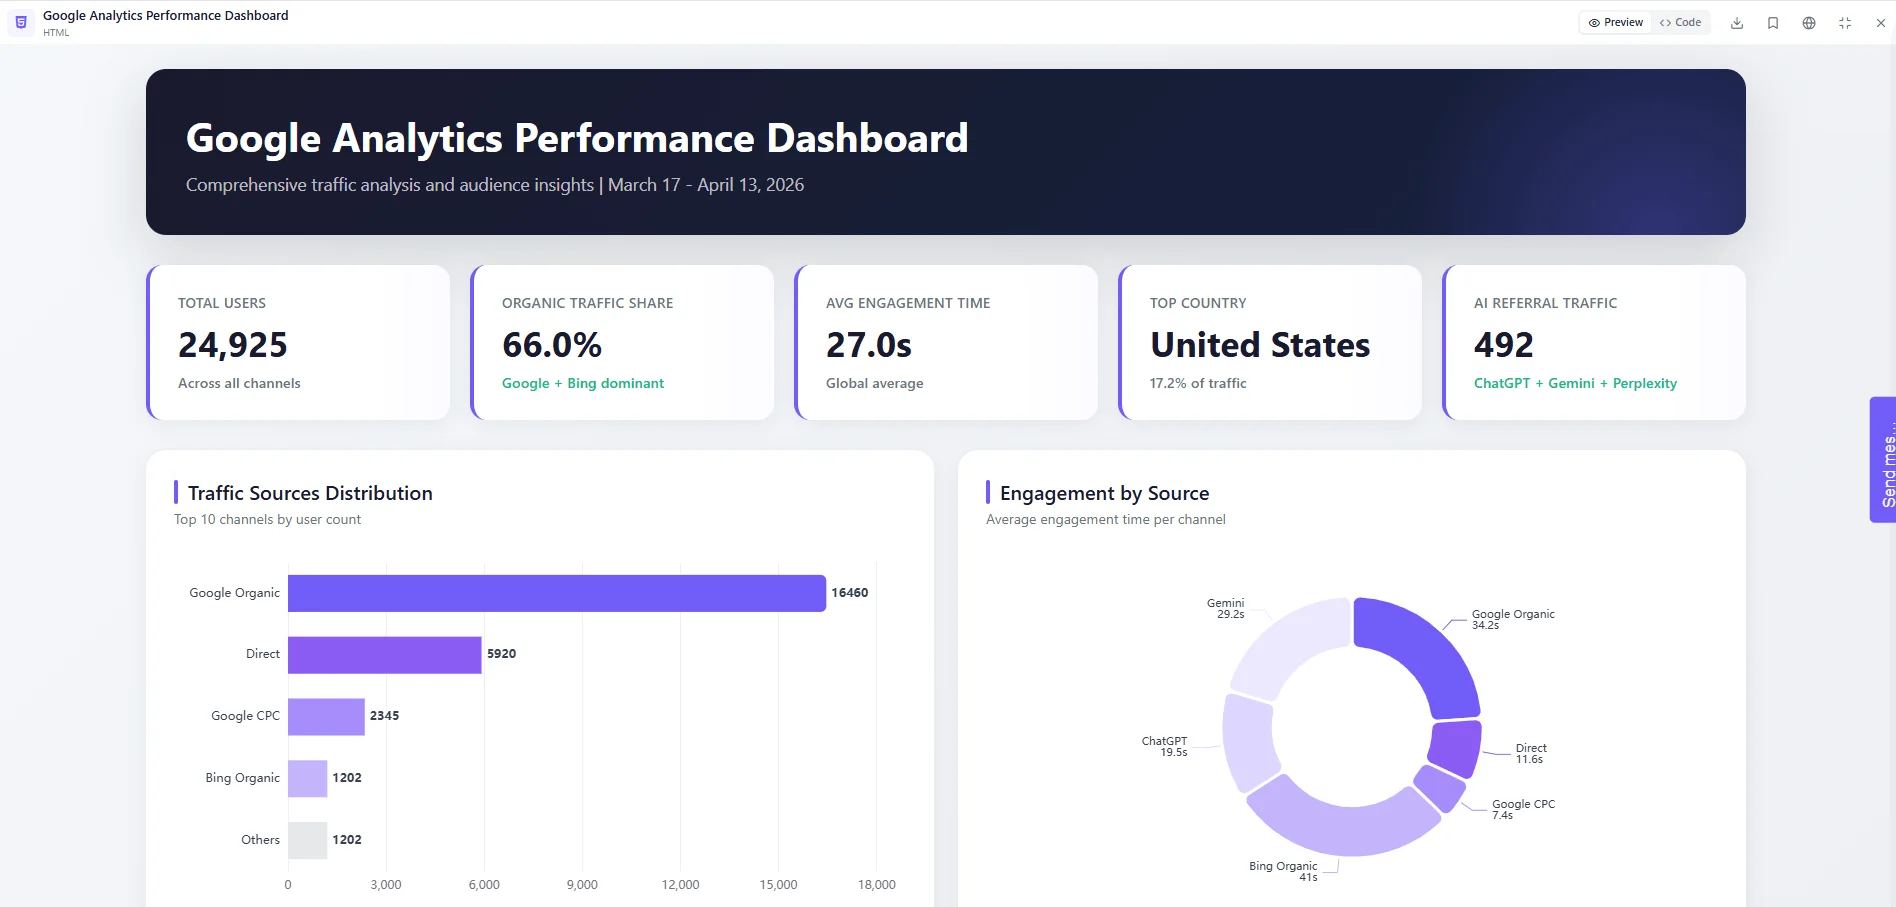
Traffic Source Breakdown
You’ll see sessions by source and medium with engagement rates per channel, not just volume. A channel driving 10,000 sessions with 20% engagement is worse than one driving 2,000 sessions with 80% engagement. Data trend analysis across channels reveals where to invest more.
Landing Page Performance
Blog articles vs. landing pages side by side, ranked by engaged sessions and average time on page. You’ll often find that editorial content significantly outperforms conversion-focused pages on engagement — a signal to double down on content-led acquisition.
Geographic and Demographic Insights
The geographic distribution view will frequently surface hidden gems: cities or countries with disproportionately high engagement time relative to traffic volume. These are high-intent markets you might be ignoring entirely. This kind of segment-level view is hard to surface manually inside the standard Google Analytics dashboard, it requires the kind of cross-referencing that AI handles in seconds.
Strategic Recommendations
The AI will generate a prioritized set of recommendations what to double down on, where to expand, which low-engagement channels to optimize or cut. These aren’t generic tips; they’re grounded in your actual data patterns.
Website Analytics Best Practices: Making This a Habit
Running this workflow once is useful. Running it monthly turns it into a genuine growth system. A few website analytics best practices to layer on top:
- Date-range consistency: Always export the same time window (e.g., last 28 days), so comparisons are valid
- Segment before exporting: Filter by device type or new vs. returning users if you want segment-specific analysis
- Add more data sources over time: Search Console data, e-commerce reports, and event tracking all feed the same workflow and produce richer cross-referenced insights from Google Analytics
- Act on one recommendation per cycle: The dashboard will surface more insights than you can act on at once, pick the highest-leverage one and move on it before the next export
The best agentic AI tools guide covers a broader comparison of platforms that support this kind of multi-file data workflow if you want to explore your options.
The Bottom Line
How to analyse Google Analytics data doesn’t have to mean hours of manual filtering, custom reports, and spreadsheet cross-referencing. Three exports, one prompt, one tool, and you have a complete picture of traffic quality, landing page performance, and audience segments that are hiding in plain sight.
The insights were always there. You just needed the right workflow to surface them.
Try it yourself at chat.ajelix.com, free tier, no credit card. Upload your own data, run the prompt, and see what you find.
Found this useful? Let me know in the comments what workflow you want to see next. More practical AI guides for website growth are coming, subscribe so you don’t miss them.
Agentic AI chat that helps you complete projects
AI for work that ingests, transforms, and delivers the exact deliverables your team needs, while you stay focused on strategy. No more chatting, agents can get the job done.