Create Report From Google Sheets Data with Agentic AI

You can create a fully interactive, branded Google Sheet report in under 10 minutes using an AI agent no formulas, no manual formatting, no developer needed. One prompt, one agent, one ready-to-share dashboard. This guide walks you through exactly how to create a report from Google Sheets, based on the workflow shown in the video below.
Why AI Agents Beat Manual Google Sheet Report Building
If you’ve ever spent an hour turning a Google Sheets export into a presentable report, you already know the problem. Formatting KPIs, building charts, adjusting colors, writing insights, it’s all manual, repetitive work.
A Google Sheet dashboard AI workflow changes that entirely. Instead of building a Google sheet report builder yourself, you describe what you want, and an AI agent handles the execution: pulling data, reasoning through the structure, writing and correcting code, and outputting an interactive HTML dashboard (you can view, use, and share), all autonomously. Here’s the dashboard I generated in the video:
The key difference from a regular chatbot is the agent mode. Chat is useful for planning and light research. Agent mode is designed to complete tasks end-to-end: it can call 50+ actions, recover from errors, read documentation, and keep working until the goal is finished.
What You Need Before You Start
- Your sales, business, or any data in Google Sheets
- The spreadsheet set to “Anyone with the link can view” (required so the AI can access it)
- A prepared prompt describing your report requirements (brand colors, logo, KPIs, layout preferences, steal a prompt I used in the video below)
- Access to an AI agent platform, the tool used in this walkthrough is chat.ajelix.com, which has a free tier
How to Generate a Report From Google Sheets
1. Prepare Your Google Sheets Data and Prompt
Before anything else, make sure your Google Sheets file is publicly accessible via a link. This is non-negotiable; if the AI can’t read the file, it can’t generate the report.
Your prompt should tell the AI agent what kind of google sheet dashboard you want. A strong prompt covers:
- What the data contains (e.g., sales data with revenue, cost, product categories, countries)
- What KPIs and charts to include
- Brand colors and whether to include a company logo
- The desired output format (interactive HTML asset, shareable link, etc.)
A well-structured prompt is the foundation of a good Google Sheets AI output. The more context you give upfront, the less back-and-forth you’ll need later. Here’s the prompt I used in the video:
I will provide a link to my Google Sheets file (sheet-url). Your task is to analyze the sales data and build a modern, interactive report with clear KPIs, filters, and actionable insights that can be easily shared with my boss and team. The report should be visually polished and executive-friendly with charts and cards, use our brand color (your-brand-color) consistently for accents and the color palette, and include our logo (your-logo-url) positioned at the top for branding. The final result should look professional, impressive, and ready for presentation.
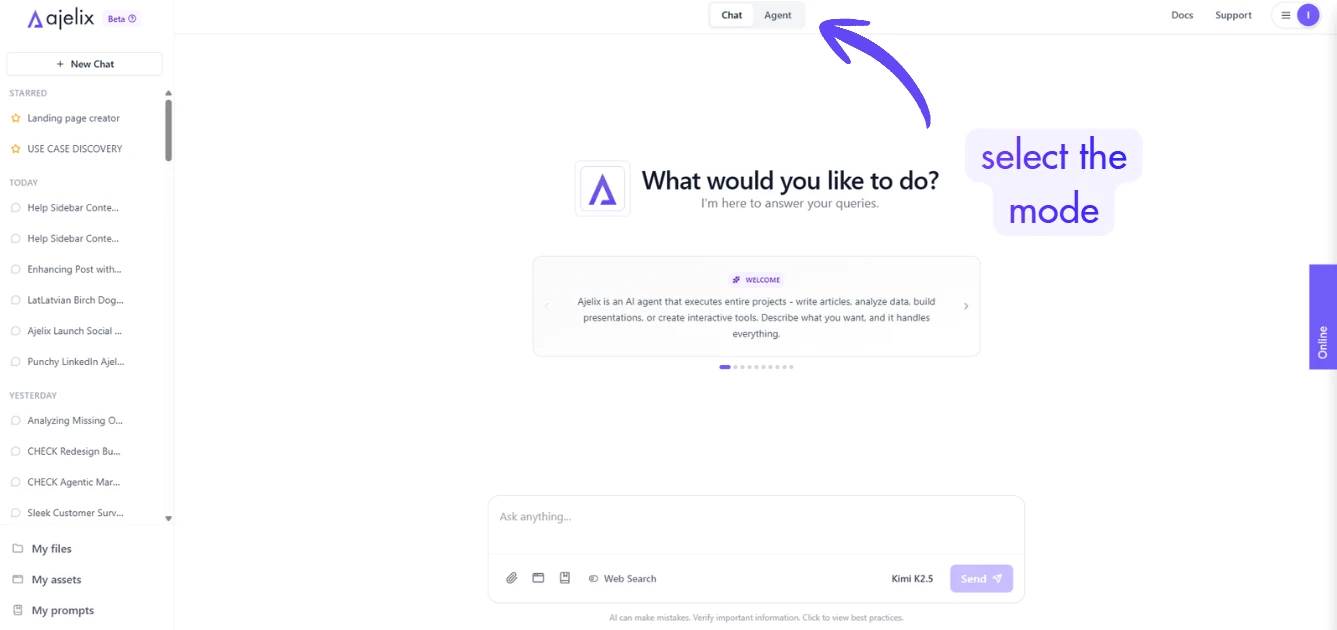
2. Switch to Agent Mode and Select the Right Model
In the platform interface, switch from Chat to Agent mode before sending your prompt. Chat handles lightweight tasks. Agent mode is built for multi-step execution: it plans, reasons, catches its own errors, and iterates until the task is complete.
For the best output when you want to make a report in Google Sheets via AI, choose the most intelligent model available, not the fastest. Slower and smarter wins here. You want depth, not speed.
3. Review the Workflow Plan
After you send your prompt, the agent doesn’t immediately start coding. It first produces a workflow plan – a breakdown of the steps it intends to take. This is your chance to verify the agent understood your intent correctly.
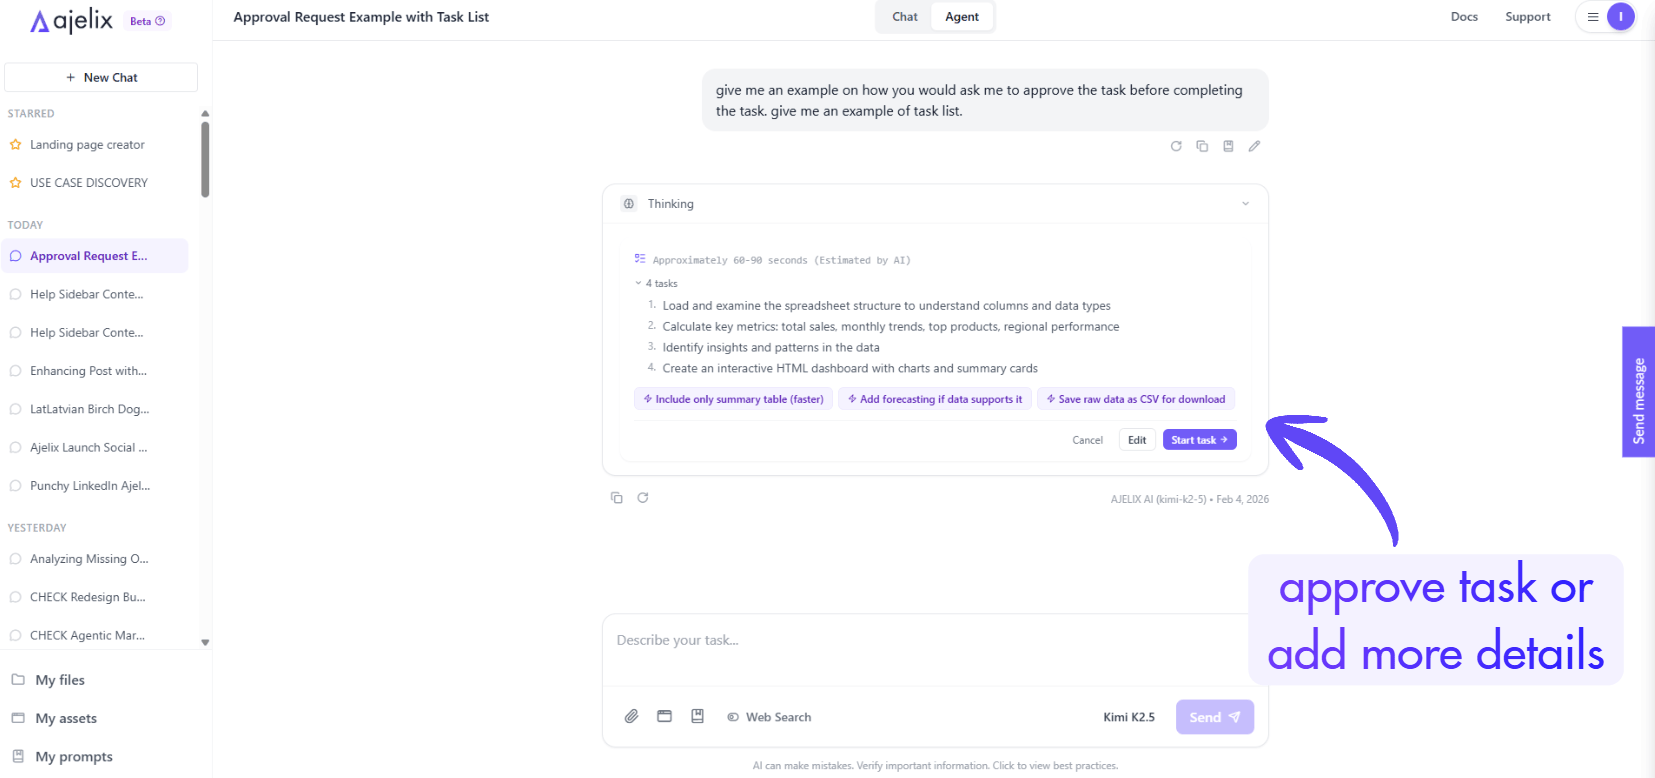
Read through it. If something looks off, add a clarifying message before approving. Once you’re satisfied, confirm, and the agent begins working.
4. Wait for the Agent to Complete
The agent will work through multiple actions autonomously. Expect it to take several minutes for a complex Google Sheet report, in the example shown in the video, it took around 7 minutes. It will handle network hiccups, correct its own mistakes, and keep working until it finishes.
When it’s done, it will deliver the output. If it produces a raw HTML file rather than a rendered asset, simply ask it to present the output as an interactive asset directly in the chat interface. It will comply.
5. Review Your Google Sheet Dashboard
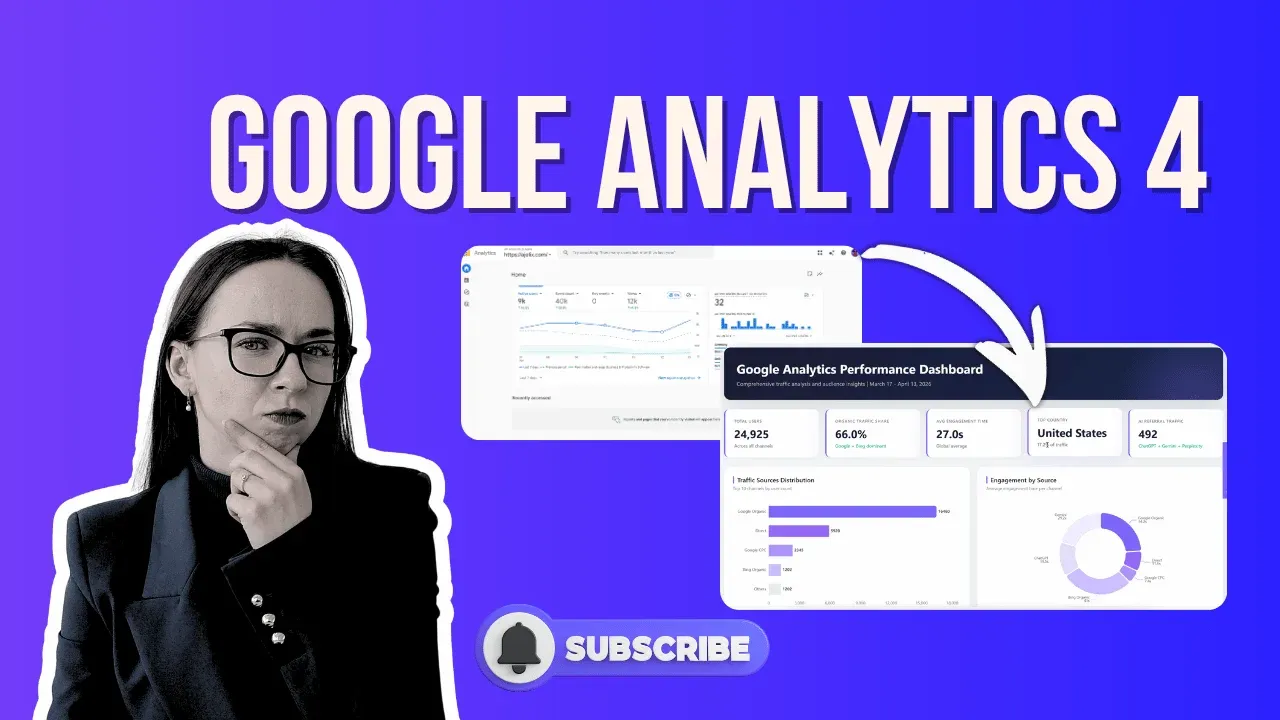
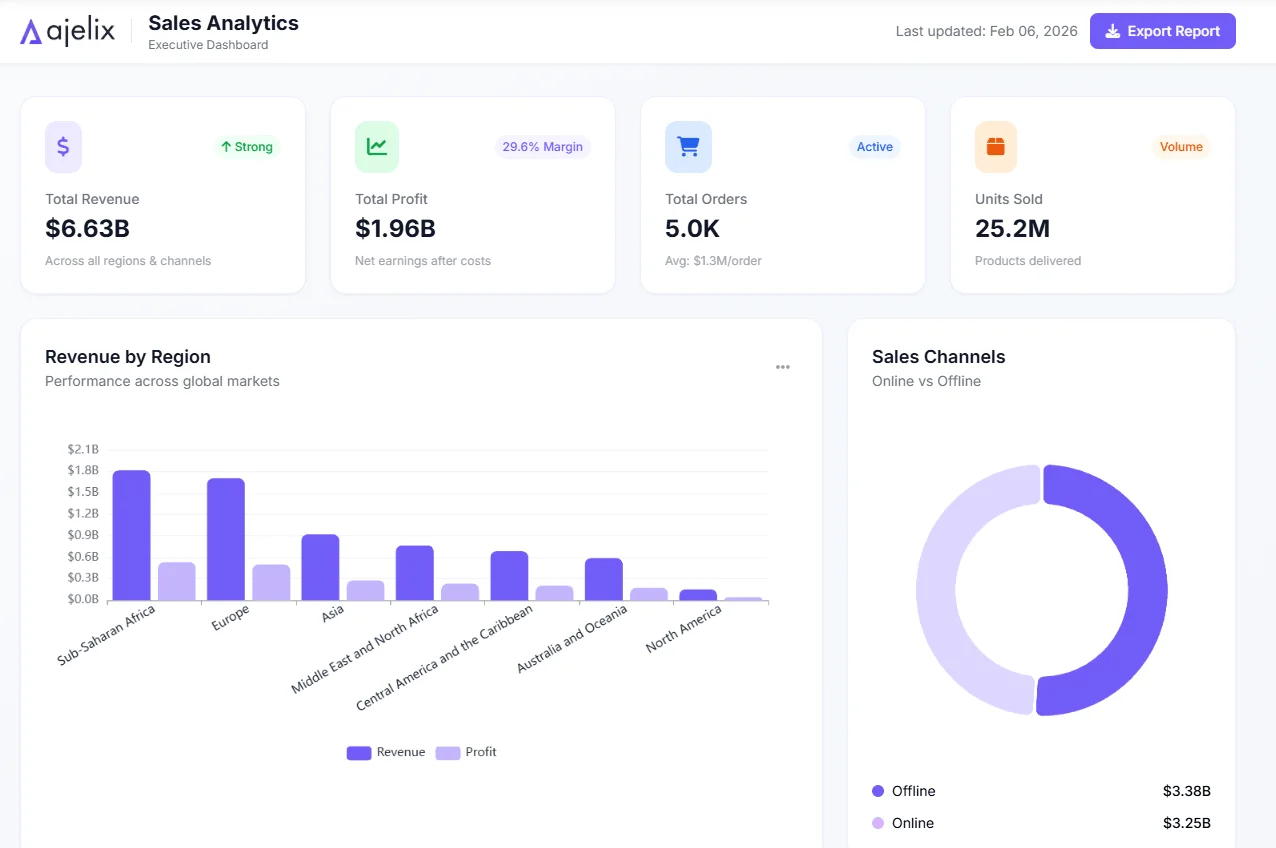
Once the dashboard renders, you’ll see:
- Key performance metrics (total revenue, total cost, etc.)
- Interactive charts (revenue trends, revenue by region, top categories)
- Top-performing segments (products, countries)
- Automatically generated key insights and recommendations
The AI pulls this all from your raw spreadsheet data, no manual chart-building required. This is what a real google sheets ai workflow looks like in practice. Here’s the dashboard I generated in the video:
You can save and customize this report to your account by clicking here.
How to Iterate and Improve the Report
This is where the workflow gets powerful for non-technical users. You don’t need to touch code. You can refine the report using plain language instructions through the AI Improve button on the asset.
Examples of things you can ask:
- “Improve the contrast ratio for the Revenue by Region chart so axis labels are readable”
- “Add a filter for date range”
- “Remove the cost breakdown section”
- “Change the primary color to match our brand”
Each change previews before being applied, so you can accept or cancel. This is essentially vibe coding a dashboard, you’re directing the output conversationally rather than writing a single line of code. The same approach works for landing pages, applications, and other interactive assets.
How to Share Your Google Sheet Report
Once the dashboard looks the way you want it:
- Save it to your workspace so it’s always accessible under your assets
- Publish it using the publish button in the interface
- Copy the link and share it with anyone, no login required on their end
The shared link stays live. When your underlying data changes, you can ask the AI agent to refresh the dashboard, and the same URL will reflect the updated report. This makes it a practical solution for recurring Google Sheet report workflows where stakeholders need ongoing access.
What Else Can You Build With This Approach
The same agent workflow that builds a Google Sheet dashboard can be applied to:
- Financial performance dashboards with tables, charts, and trend lines
- Filtered interactive reports with slicers and dynamic segments
- Customer satisfaction survey apps built from form data
- Monte Carlo simulators and other quantitative tools
- QR code generators and other lightweight business utilities
- Landing pages and presentations from a single prompt
All of these can be built, saved, shared, and iterated on without deployment, without a developer, and without leaving the interface.
Key Takeaways
Learning how to generate a report from Google Sheets used to mean manual formatting or hiring someone technical. With AI agents, the workflow is now: share your data, describe what you want, review the plan, and let the agent execute.
The result is a fully interactive Google Sheet dashboard that can be published, shared via link, and updated on demand, all from a single conversation.
If you want to try this yourself, head to chat.ajelix.com and start with the free tier. Drop a comment on the video above with your use case, and I’ll cover it in a future walkthrough.
FAQ
No, but better data produces better reports. AI is able to clean data and remove formatting to get better results, so you don’t have to worry about that. But there are main data formatting practices, like column headers should be clear and descriptive, data should be consistent within each column, and there shouldn’t be large blocks of merged cells or completely empty rows scattered through the sheet. Standard tabular structure headers in the first row, data below is all the AI needs to work with.
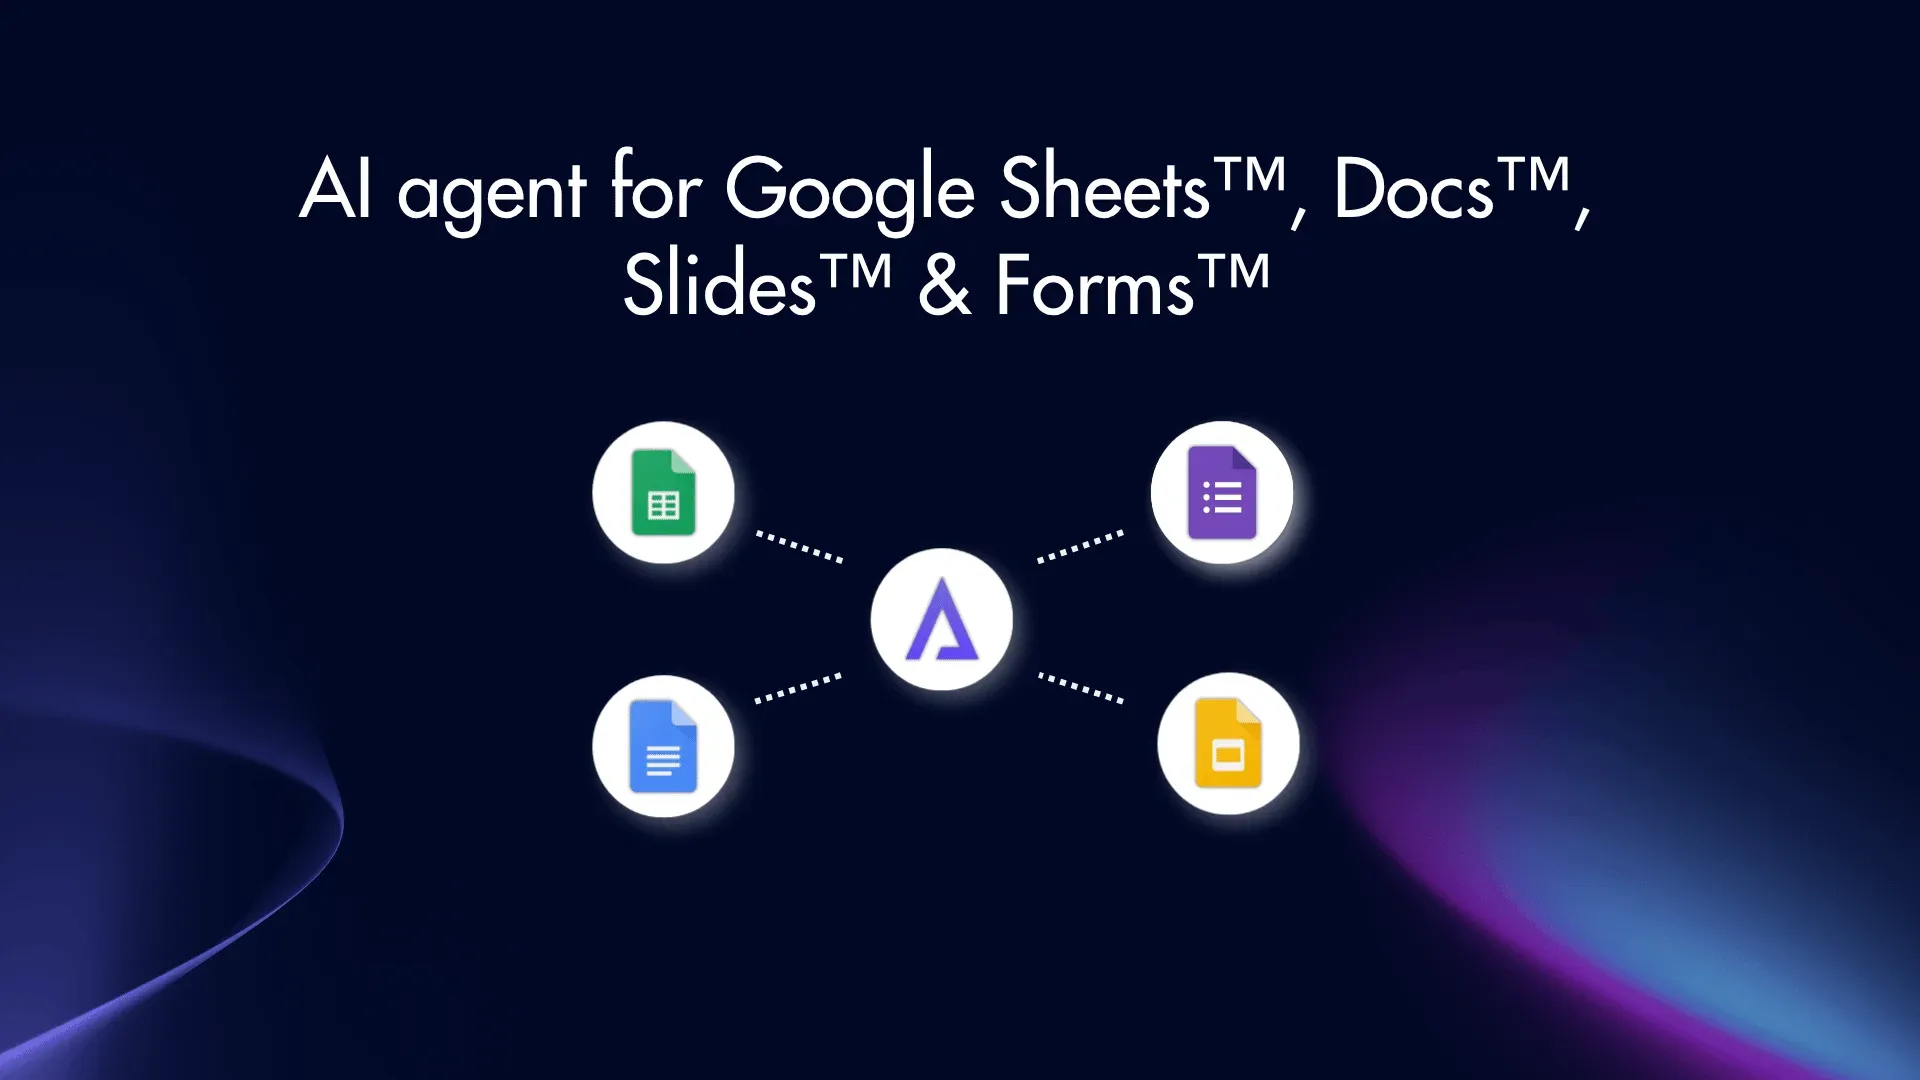
The AI agent accesses your Google™ Sheet via its public URL, the same way any browser would. Setting it to “Anyone with the link can view” doesn’t make it searchable or indexed; only someone with the exact link can open it. If your data is sensitive, consider setting up Google™ Cloud Console access and enable Google™ Sheets skill. We have a guide on how to connect Google™ Workspace apps here.
Chat mode is suitable for simple tasks, quick questions, and planning. Agent mode is designed for multi-step execution, it reasons through a problem, takes sequential actions, handles errors on its own, and keeps working until the task is complete. Building a full interactive Google Sheet dashboard requires dozens of actions (reading data, writing code, fixing bugs, rendering output), which is why agent mode is necessary. Chat mode would stop short of a finished result.
For a typical sales or business dataset with charts, KPIs, and insights, expect anywhere between 5 and 10 minutes. The agent is doing real work in the background: reading your data, planning the structure, writing code, and correcting any issues it encounters. Choosing a more intelligent model will take longer but produce a significantly better output.
Any structured data works. The workflow shown uses sales data, but the same approach applies to financial reports, HR data, marketing metrics, survey results, inventory tracking, or any other tabular dataset. Your prompt just needs to accurately describe what the data contains and what kind of report you want from it.
That’s exactly what the workflow plan step is for. Before the agent starts executing, it shows you its intended approach. If something looks off, you can clarify before any work begins. If you only notice an issue after the report is generated, you can still use plain-language instructions to fix it, add a section, remove a chart, or change colors without starting over.
No. All improvements are made through plain language instructions. You describe what you want changed, and the AI applies it. If you are technical, the underlying code is accessible and editable directly. But coding knowledge is entirely optional; the workflow is designed to be usable by non-developers.
Yes. Once you publish the dashboard, you get a shareable link that anyone can open, no account or login required on their end. This makes it practical for sharing reports with clients, stakeholders, or teammates who don’t use the tool themselves.
The free tier at chat.ajelix.com is sufficient to run basic workflows and generate reports. For heavier use, larger datasets, more frequent report generation, or access to the most intelligent models, a paid plan may be worth considering, but the free tier is a solid starting point to validate whether the workflow fits your needs.
Agentic AI chat that helps you complete projects
AI for work that ingests, transforms, and delivers the exact deliverables your team needs, while you stay focused on strategy. No more chatting, agents can get the job done.